Buying the Yen ETF

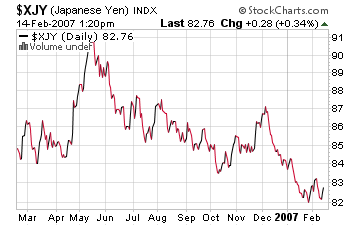
In my previous post I mentioned that I was sitting on 20% cash. Today I decided to use almost all of that cash to buy the CurrencyShares Japanese Yen Trust (NYSE:FXY) for $82.75 per share. In effect, I am still in cash — albeit yen rather that dollars.

My motivation for this trade is that I believe the yen carry trade will soon end, which will cause the yen to appreciate against most currencies. Last year, the yen was one of the worst performing currencies in the world. This year it could be the best.

yen_performance

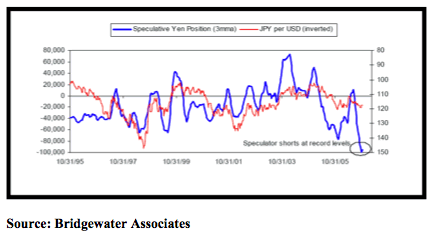
As a contrarian, I am also delighted to see that there is a record speculative short position in the yen.

short_positions_yen

It should be noted that, unlike the other CurrencyShares, the Japanese Yen Trust currently doesn’t pay any dividends because Japanese interest rates are barely able to cover the trust’s expense ratio. But I believe a rise in the yen will more than make up for this shortcoming.

Getting Nervous of Gold

Clearly we are in a world flush with cash. This has resulted in strong asset prices almost across the board. However, liquidity could suddenly dry up very quickly leading to a downturn in asset prices. Likely triggers for this occurrence are a further slowdown in the US economy or the unwinding of the yen carry trade.

Gold, too, has benefited as can be seen in its recent strength even though the US dollar has been stable. I have made the case before that gold should perform inversely to the US dollar. This relationship may breakdown from time to time but not for long. The abundance of liquidity has encouraged financial institutions to buy a wide range of assets. If liquidity were to dry up, then the same assets that were purchased before could be sold, including gold.

Don’t get me wrong — I am still very bullish on gold in the long-term. On the first sign that the global economy may sink into a recession, central banks around the world will run their money printing presses on full steam. The money supply will explode similar to the 70’s causing asset prices to resume their uptrends, with gold enjoying the greatest rise.

However, caution should be exercised in the near-term. Now is a great time to liquidate assets. I recently took profits in a number of my gold stocks. Currently, I have 70% of my portfolio invested in the gold sector, 10% short on brokers and small cap stocks, and 20% in cash.

Yen Carry Trade Could End in 2007

The yen carry trade has been a major source of global liquidity since 2001 when Japan’s central bank cut rates to nearly zero while managing the US dollar-yen exchange rate. It’s intention was to stimulate Japan’s consumer spending and exports.

This policy allowed financial institutions to borrow funds from Japan and invest in assets offering higher returns such as emerging market equities and US bonds. For example, a hedge fund could borrow $100 million from Japan at 0.4% interest and use leverage to buy $1 billion short-term US treasury bonds yielding 5%. After one year, the hedge fund could close the bond position with $150 million. After paying off the loan in Japan it’s net profit would be close to $50 million and it would have earned a 50% return.

This assumes that Japanese interest rates don’t go up and the yen doesn’t appreciate. On January 18, the Bank of Japan decided not to raise rates and keep its key short-term rate at just 0.25%. With no signs that interest rates will rise anytime soon, the carry trade has picked up steam. According to a January 26 report by Barclays Capital the magnitude of yen-funded carry trades “is reaching scary levels” not seen since 1998.

Also, speculative short positions in the yen are at record levels:

short_positions_yen

Being a contrarian, I suspect that the yen carry trade will still reverse in the near future. Although Japanese interest rates may not rise, the carry trade could become unprofitable if the yen started to appreciate against other currencies. This is possible if Japan’s economy strengthens leading to greater corporate profits and rising equity prices. Then the Japanese stock market, which was one of the wost performing stock markets last year, would begin to out-perform global assets. This would cause capital to return to Japan and the yen to appreciate.

Another possibility is that the weakness in the US housing market causes consumer spending to taper off and the economy to slow down. In response, the Fed would cut rates which would cause inflation to accelerate and the bond market to decline. The US dollar would weaken making a major portion of carry trades that borrow yen to invest in US bonds unprofitable. Hedge funds would then be forced to cut losses and return the capital to Japan causing the yen to appreciate further. This would lead to a reversal of carry trades that invest in assets in other parts of the world. In the end, global asset prices could plummet.

Of course sudden and unexpected non-economic events could also blow up the yen carry trade. Possible triggers include an escalation in Middle East tensions, major terrorist attacks or a bird-flu pandemic.

Last spring the world got a taste of how bad asset markets could falter when the Bank of Japan announced its intention to abandon the zero interest rate policy. The yen appreciated against the US dollar by 8% during April and mid-May. Hedge funds began to unwind the carry trade in May and the ensuing sell-off in asset prices continued through mid-June. The S&P 500 fell by 5%, Japan’s Nikkei fell by 17%, most emerging markets’ equities fell by 20-30%, gold fell by 22%, and copper fell by 21%.

In late 1998 Russia’s debt default accelerated the implosion of Long-Term Capital Management LP and caused a panic in markets. Investors scaling back their carry-trade positions drove the yen up 20 percent in less than two months.

The best way to play this is to go long yen. Since I don’t trade futures I intend to simply sit on the sidelines and watch as asset prices fall. Hopefully, gold will also correct which would present an opportunity to buy some of my favorite gold stocks cheaper than today.

Should China Be Worried About Inflation

During 2006 China’s GDP grew by 10.7% vs. 10.4% in 2005. As I have discussed previously, China will continue to experience hyper-growth as long as US consumer spending does not falter. However, this looks like a low probability scenario given that the US housing market, which played a large part in boosting consumer spending during the last 5 years, is clearly in a recession.

Another cause of concern for China’s policy makers is the recent increase in inflation. Although the government reported that inflation increased by only 1.5% during 2006, December saw inflation rising 2.8% year-on-year. It is important to keep in mind that China’s government is similar to the US’ in constructing the CPI as a measure of inflation with a bias to understate. So actual inflation is likely to be even higher.

Asset prices have sky-rocketed as can be seen in the real estate and stock markets. Also, wages are increasing over 10% annually. The one sector which has been immune to inflation is manufactured goods due to increasing capital investments leading to economies of scale. But this can’t go on forever and continued cost savings will most likely end when US consumers reduce purchases of Chinese goods leaving manufacturers with excess capacity.

Rising inflation is inevitable due to China’s current policy of pegging the yuan to the US dollar. This has forced the central bank to recycle export earnings from dollars and other hard currencies into yuan leading to a blowout of the money supply which will eventually cause prices to rise. In December M2 increased by 17% year-on-year, much faster than GDP growth.

The central bank is trying to combat monetary inflation by selling bonds to commercial banks and mopping up some of the liquidity. In the long-run, this is ineffective and actually counter-productive since it will cause an increase in interest rates leading to further foreign capital inflows and monetary expansion.

There is only one way out of the inflation problem for China. The yuan must be allowed to trade more freely at a higher value, which would reduce capital inflows and credit expansion. Intense pressure by Chinese manufacturers, who have benefited from the undervalued yuan, has caused policy makers to contain the rate of the currency’s appreciation.

It is certain that the yuan will trade at a much higher exchange rate against the US dollar and Euro a few years from now. However, it is less certain that the appreciation will occur before China’s inflation gets out of control.

Housing Recovery Still Far Off

Heading into the new year, the consensus seems to be that housing is bottoming. The people who hold this view point to the November housing data:

  • Existing home sales rose in November following October’s increase. Down 10.7% year-over-year.
  • Total housing inventory fell by 1%. Up 30% yoy.
  • New Home Sales rose by 3.4%. Down 15.3% yoy.
  • Housing starts increased 6.7%. Down 25.5% yoy.

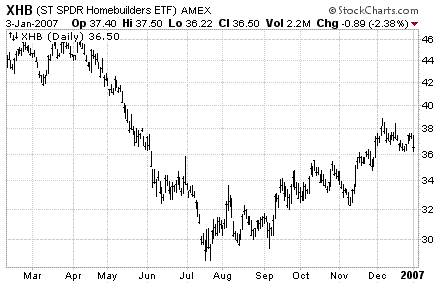
And as expected the stocks of home builders have been rallying:

xhb_price_chart

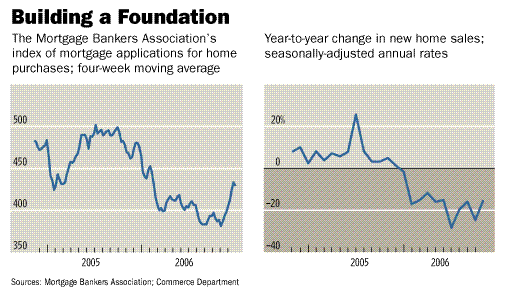
What could have caused this increase in housing activity? Three things come to my mind: 1) a reduction in prices or greater incentives offered by sellers who are unable to make their mortgage payments and are desperate to sell their homes, 2) falling mortgage rates causing mortgage applications to rise according to the MBA survey, and 3) an increase in real wages.

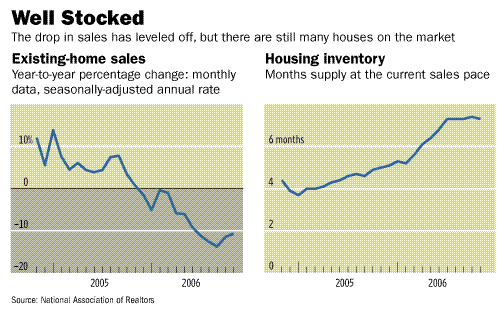
Whatever the reason it’s important to put this data in the proper context. Over the past year home sales still are in a downtrend and inventories are near recent highs. And as any chartist knows, no data or price action will trend upwards or downwards in a straightline — pullbacks are to be expected. Looking at the following graphs by the Wall Street Journal, I find it hard to conclude the housing is out of the woods just yet.

housing_data_2housing_data

I have been a housing bear for a long time and the fundamentals still have not improved. Here are some reasons why I think housing activity will slow even further:

  1. The number of building permits issued, a good forecaster of future housing activity, fell by 3% in November as compared to October.
  2. The rate of home buying cancellations which has exploded is not factored into the home sales and inventory data which will lead to major downward revisions later on.
  3. According to past housing cycles, the peak-to-trough decline in housing starts is 47.3%. In the current cycle housing starts have so far only declined by 24.4% from February 2005’s peak.
  4. Households are spending a record percentage of their incomes on mortgage obligations.
  5. The recent rise in foreclosures will lead to a tightening of lending standards.
  6. Mortgage rates will increase due to foreigners reducing their US debt purchases.

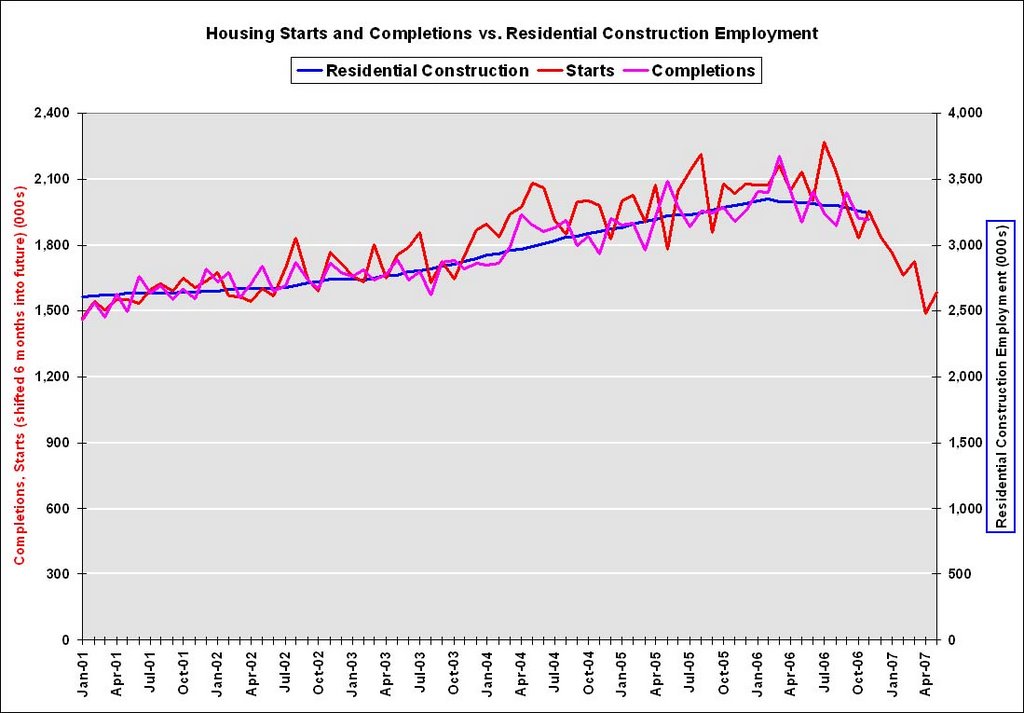
For these reasons I believe housing is going to continue being a drag on the economy in 2007. How much of a drag? To answer this I like to refer to an excellent chart by Calculated Risk. According to Calculated Risk:

This graph shows starts, completions and residential construction employment. (starts are shifted 6 months into the future). Completions and residential construction employment are highly correlated, and Completions lag Starts by about 6 months.

Based on historical correlations, it is reasonable to expect Completions and residential construction employment to follow Starts “off the cliff”. This would indicate the loss of 400K to 600K residential construction employment jobs over the next 6 months.

In addition to the residential construction layoffs, there will be significant job losses among real estate agents and mortgage brokers. Approximately half of all private sector jobs created since the 2001 were tied to housing. The loss of most of these jobs should easily be enough to tip the economy into a recession.

ProShares ETFs

Last July ProFunds released an interesting ETF product, called ProShares, which can provide double the inverse performance of some of the major indices. These are in addition to several other ProShares leveraged offerings:

Fund Ticker Benchmark Index
Leverage
Short QQQ PSQ NASDAQ-100
minus 1x
Short S&P500 SH S&P 500
minus 1x
Short Dow30 DOG DJIA
minus 1x
Short MidCap400 MYY S&P MidCap 400
minus 1x
Ultra QQQ QLD NASDAQ-100
2x
Ultra S&P500 SSO S&P 500
2x
Ultra Dow30 DDM DJIA
2x
Ultra MidCap400 MVV S&P MidCap 400
2x
UltraShort QQQ QID NASDAQ-100
minus 2x
UltraShort S&P500 SDS S&P 500
minus 2x
UltraShort Dow30 DXD DJIA
minus 2x
UltraShort MidCap400 MZZ S&P MidCap 400
minus 2x

There already exists a few open ended mutual funds from ProFunds and Rydex that do the same thing, but they come with expense ratios of around 1.5% compared to only 0.95% for the ProShares.

As a bear I was attracted to the double inverse ProShares since they can be held within retirement accounts. I would also be interested in holding them in my non-retirement accounts if they offered more leverage than shorting. Due to the margin requirements of my broker I am required to have 130% of the value of a short position of any option eligible securities. Buying ProShares, on the other hand, requires margin of 50%.

To use the UltraShort S&P 500 (AMEX:SDS) as an example, every $100 of margin in my account allows me to hold $200 of the SDS (or $200 of double the inverse of the S&P 500). If I were to short $200 of the S&P 500 in the traditional sense through the Standard & Poor’s Depository Recipts (AMEX:SPY), I would need only $60.

Now let’s say the S&P 500 declined by 10% after 1 year. Then my $200 holdings of SDS will gain by 20% or $40. Since I invested only $100 my return would be 40%. On the other hand, my $100 would allow me to short a maximum of $333.33 of SPY. Since the S&P 500 fell be 10% the SPY will fall by 10% too. Under this scenario I would gain $33.33 or 33.33%.

Of course leverage can work both ways: if instead the S&P 500 had increased by 10% I would have lost 40% through buying the SDS compared to only a 33.33% loss by shorting the SPY.

There are some other costs associated with holding the UltraShort ETF’s that were not factored in this analysis. First, buying with margin entails interest expenses on the loan amount. In my case, currently my broker charges 6% annually. Second, there is an expense ratio of 0.95% for all ProShares. And third, the funds employ swaps which can have negative tax consequences.

As good as these ETFs are, they are not superior to shorting or even futures which can offer much more leverage. These products are better suited for accounts that are unable to short like retirement accounts.

I currently own the SDS and the UltraShort MidCap 400 (AMEX:MZZ) in my retirement accounts.

Copper Prices Set to Fall

I have been nervous about base metal prices, particularly copper, for some time now. Low interest rates worldwide have allowed many hedge funds to engage in the carry trade by borrowing capital in places like Japan and investing it in everything from real estate to emerging market stocks. Earlier this year commodities became the target for their speculative buying.

How else can one explain that from December ‘05 to May ‘06 aluminum was up 50%, copper was up 100%, nickel was up 70%, and zinc was up 120%? Surely increased demand from China nor supply disruptions can entirely account for such spectacular gains.

Gold, too, increased by 60% even though the US dollar hardly fell. This was most likely due to hedge fund managers who entered the commodity markets and bought gold along with other base metals without realizing that precious metals are monetary assets that have very different factors affecting their prices. Therefore, my concern for base metals stems from the belief that once the speculators exit commodities (or start betting against them), gold could also be sold off.

Many speculators have already exited with copper down 25%, aluminum down 10%, and gold down 15% from their May highs. Incidentally both nickel and zinc are up an astounding 50% and 23%, respectively since then. Despite this, more downside could lie ahead for base metals and by extension gold as the supply-demand fundamentals paint a bearish picture.

copper_price

Copper, which is often seen as a harbinger for economic trends, looks particularly vulnerable. While the common perception is that China is the main driver for copper demand, in reality, the US economy is far more important. It may be true that China consumes 22% of global copper production compared to 13% for the US. But most of the Chinese demand can be attributed to manufacturers who use the copper they buy to produce goods that are eventually exported to the US.

Another source of copper demand is China’s growing infrastructure investments which are meant to expand manufacturing capacity. Therefore, a slowdown in the US will hurt China’s export sector and will cause a reduction in Chinese copper demand. I believe a US recession is imminent.

Already China is starting to move away from its investment-driven growth, shifting toward a more goods-related economy — a situation expected to tame its previously voracious appetite for copper. Chinese copper consumption declined by 4.7% in the first 10 months of the year according to the World Bureau of Metal Statistics.

In addition, copper demand from direct US consumption could suffer if the housing market, which consumes a quarter of the US copper demand, deteriorates. The average 2,100 sq.ft. single-family home uses 439 pounds of copper, most of which is for wiring and plumbing. If US housing starts were to fall by one million homes (about 50%) the reduction in US demand would be just under 200,000 tonnes of copper. This translates to an 8% reduction in US demand and a 1.25% reduction in global demand.

At the same time, the extended period of high copper prices has reduced demand, as alternatives have been found in aluminum and plastics. Independent industry consultant Simon Hunt estimates that around 3.5 million tons of copper in all forms could be replaced by alternative materials by 2010.

Global copper inventories monitored by exchanges in Shanghai, London and New York are the largest since 2004 after almost tripling in the past 18 months. Next year copper supplies will continue to rise, as several large-producing mines — Escondida, Codelco’s Chuquicamata, Grupo Mexico’s La Caridad and Cananea — return to full production, while expansions at Codelco’s Andina and Antofagasta’s Los Pelambres will also hit the market. Other mines such as BHP Billiton’s Spence, Phelps Dodge’s Cerro Verde, Equinox Minerals’ Lumwana and First Quantum’s Frontier will also come online for the first time.

Based on the median forecast of 11 analysts surveyed by Bloomberg copper is expected to fall to $2.61 a pound on average and will reach $2.10 in 2008. However any sort of collapse in the price of copper should be supported by a falling US dollar which I expect to pick up pace in 2007. This would cause copper’s US dollar price to appear stronger than it really is. My own forecast is that copper could trade between $2.50 and $2 per pound by the end of next year. I wouldn’t be surprised if it declines below $2 at some point in the future. However, if it reaches $1.50 I may go long.

Will Cramer Be Right?

I found some excerpts of an interview that BusinessWeek conducted with CNBC’s star personality Jim Cramer. When asked about his outlook for 2007, he doesn’t hide his bullishness:

I think it’s going to be real good… We have incredibly low interest rates. Forget the big mortgage problem. The big story for 2007 is that we just don’t have enough stock. Twenty-nine of the 30 stocks in the Dow Jones average have buybacks. If you take a look at the moves you see in stocks now, it’s because there are just no sellers… Then layer on the fact that the private equity guys have just raised $3 trillion… Those forces are all fabulous for the market.

Now I’m no fan of Cramer’s but I thought I would simply make a note of it so that 12 months from now we can look back and see if he’s right.

Cramer’s a sharp, charismatic and hard working individual but that doesn’t necessarily make someone a great investor. He always prefers to go long on stocks. When stock prices decline, he simply increases his position betting that the market is merely experiencing a correction. This strategy works well during bull markets. Not surprisingly he came to prominence as a successful hedge fund manager during the eighties and nineties — a period when stocks were on a spectacular bull run. During a bear market his strategy could cause him to underperform the market.

I think difficult times are ahead for the stock market — and Jim Cramer’s popularity.

Yuan Appreciation Accelerating

Since September when I speculated that a yuan revaluation was imminent, China’s currency has appreciated by 1% or at an annual rate of 4% against the US dollar. However, the current rate of 7.82 yuan/dollar is still too high and has done nothing to reduce the China-US trade balance.

A high-level delegation to Beijing from the United States led by US Treasury Secretary Henry Paulson and Federal Reserve chairman Ben Bernanke will meet with their mainland counterparts Thursday for two days of talks aimed at resolving trade disputes.

There is no doubt that China will face additional pressure to increase the pace of the yuan’s appreciation. China is hesitant to allow its currency to float more freely due to the pain that it would cause to its export sector and the inability for its capital markets to manage a more flexible yuan. Instead China would prefer seeing its currency rise gradually at 5% or so a year giving ample time for exporters to adjust to a stronger yuan and for additional reforms to be carried out in the financial sector.

The problem is that the US will not be patient enough to wait for the yuan to gradually appreciate, while its trade deficit remains high. You can bet that the US will retaliate with significant tariffs on Chinese goods if this is the case. This would be the worst situation for China since its export-led economy would struggle. If instead China revalues its currency by the tariff rate, then it could combat weakness in exporting with lower import prices and less US dollar reserves buying which could be used to stimulate the economy.

Therefore, I expect that the yuan’s appreciation that we have witnessed in recent months to pick up through a faster crawl and/or by a surprise revaluation announcement. My forecast is that the US dollar will be trading at less than 7 yuan by the end of 2007.