Author Archives: Administrator

Adding to My Gold Position

Gold hit a 27-year high last week in response to the Fed’s 50 basis points cut which showed that the central bank was more concerned about economic growth than restoring confidence in the US dollar. The economy is on the path to a recession and it looks like the Fed and the government will do everything in their powers to prevent it, and in the process, devalue the dollar against other currencies and gold.

Earlier in the year, I was a net seller of gold stocks (as discussed here and here) due to my fear that a liquidity crisis would soon develop and all assets, including gold, would endure some short-term weakness. The liquidity crisis did occur, and though gold held up well, junior gold explorers have declined by 30% to 50% since August. While I am still pessimistic on a significant rebound for bonds and equities, gold should see gains thanks to the Fed’s expansionary monetary policies.

I have now started to increase my position in gold juniors and will continue to do so in the coming weeks until I am fully invested in the sector again. The gold price may pullback, but the gold juniors have been beaten up so badly that a lot of the risk is gone. I am more confident than ever that we will see $1000 gold within the next couple of years and I want to position my portfolio again to benefit from that.

The Fed Yields to Wall Street

With yesterday’s announcement of a 50 basis points cut to the federal funds rate, the Fed has officially shifted their expansionary monetary policies to high gear. Their previous move was a hike to 5.25% on June 29th of last year. A month later, when the market was debating whether the next Fed action would be a cut or hike, I stuck my neck out and guessed that an interest rate reduction would be more likely given the drag that the troubled real estate sector would exert on the rest of the economy.

I was wrong about the timing of the cut to the benchmark rate, expecting it to take place much sooner in response to a weakening economy. But the effects from falling home prices and plummeting housing starts have taken a little longer than I thought to filter through the economy. I still expect the economy to stumble into a recession and the Fed to respond with many more rate cuts.

Will it work to keep the recession brief? I am not sure. But I am quite sure that the Fed’s expansionary monetary policies will shake confidence in the US dollar, lead to higher commodity prices, stimulate consumer price inflation, and cause the gold price to exceed $1000 in the not too distant future.

I realize that many people will counter my argument by pointing out that Alan Greenspan printed as much money as all the other Fed governors combined, yet inflationary pressures remained subdued for most of his 19-year term. But that period was marked by the fall of communism and the rise of capitalism across the third world, which allowed production to be shifted to lower cost regions. However, as the recent rise in prices of imports from China indicates, the effect of globalization is receding.

The irony in all of this is that the Fed’s willingness to lower rates and sacrifice the dollar in exchange for economic growth does not address the underlying problem of excessive credit creation, but actually makes it worse by creating a bubble in some other asset class. Perhaps the next bubble will be in gold and commodities.

Jobs Data Suggests Recession is Near

The August nonfarm payrolls data caught many people off guard when it showed the economy shed 4,000 jobs during the month. This was the first loss in 4 years. And to add insult to injury payrolls for June and July were revised down by a combined 81,000 jobs. The large revisions are one of the reasons I ignore the freshly reported payrolls figure.

Many bulls believe the economy will continue to perform well because unemployment is at very low levels which should lead to growth in wages and consumer spending.

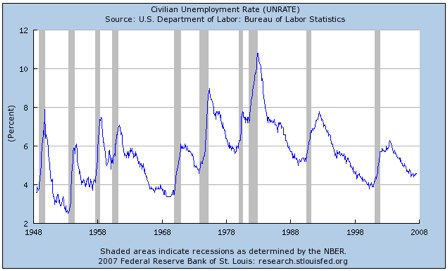
St. Louis Fed_ Series_ UNRATE, Civilian Unemployment Rate

However, as the above chart shows, the unemployment rate is a coincident economic indicator. Therefore, when the unemployment rate is low, as it is now, it merely suggests that the economy has been doing well, but by the time we realize that it has reversed higher, the economy is already in a recession.

Also, the unemployment rate, by definition, may not give an accurate picture of employment. Here is how the unemployment rate is calculated:

Unemployment Rate

The unemployment rate can decline when the number of people employed increases, which has been occurring based on the payrolls data of the last few years. But the unemployment rate can also fall when people leave the labor force, most likely due to difficulties in finding satisfactory work. The following graph plots the civilian employment – population ratio (EMRATIO) to strip out changes in the labor force.

EMRATIO

Adam Oliensis makes the following comments regarding this chart:

What makes itself apparent to my eye is that any time the EMRATIO has fallen by as much as 0.5% from a local high it has fallen much further than that (usually 2-3%) and any time a fall of that magnitude has occurred there has been a recession.

The EMRATIO has now fallen about 0.6% since its peak in December 2006. So, if the “forces of nature” that have governed the economy continue to operate as they have over the past 50-60 years, it looks like we’re in for a larger fall in the EMRATIO (2-3%) and for a recession.

Interestingly, the EMRATIO, like the unemployment rate, has historically been a coincident indicator of economic growth. But this year the EMRATIO has been falling, while the government’s GDP report shows positive growth. Perhaps the GDP report would paint a recessionary picture if inflation was properly calculated. In any case, the EMRATIO debunks the bull case that the employment market is strong.

The Trade Deficit is the Only Bright Spot for the Economy

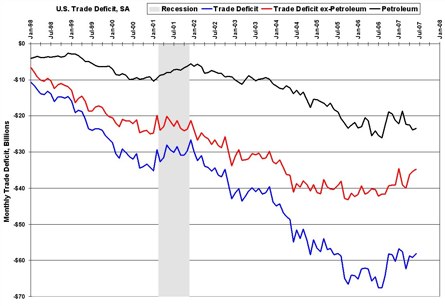
Here is a look at the US trade deficit since 1998:

Trade+Deficit+June+2007.jpg (image)Graphic by Calculated Risk

It appears that the monthly trade deficit bottomed in July 2006 and has been improving since then. This is evidence that the US economy has been slowing relative to the rest of the world and the falling US dollar has made US exports more attractive.

If the US economy continues to deteriorate, as I expect it will, then the Fed will significantly reduce interest rates, causing the dollar to fall further and the trade deficit to continue to improve. This would be bad, of course, for America’s largest trading partners such as China, Japan, Canada, Mexico, and Germany. But it may help to keep the US from a protracted and severe recession.

The one wild card in all of this is energy prices. If the prices of oil and natural gas surge higher then the overall trade deficit could actually increase even in the face of a decrease in imports of manufactured goods and a rise in exports.

Shorting MBIA

Today I shorted MBIA (NYSE:MBI) at $61.29. The bearish outlook for MBIA is presented here. Basically, MBIA is a credit insurer of products such as municipal bonds, MBS, and CDOs. The problem is that the company has insured over $200 billion of structured finance assets while maintaining a total statutory capital base of only $7 billion to payout on defaults. Therefore, a mere 3% structured finance loss will wipe out MBIA’s entire capital base.

And even if structured finance losses remain under 3%, a loss of as little as $500 million in MBIA’s statutory capital base could impair its AAA rating. That would put it at a significant competitive disadvantage against other credit insurers.

I want to point out that I ordinarily would not short a stock like MBIA. But most of my portfolio consists of microcap gold juniors whose share prices are very vulnerable to a further deterioration in credit markets and a deflationary environment. If this occurs, then shorting a stock such as MBIA should hedge against some of my losses.MBIA

The ‘Financialization’ of the US Economy

A couple of insightful posts by Sudden Debt here and here elucidate how dependent the US economy has become on a growing financial sector:

About 20% of S&P 500 by capitalization and 30% of earnings are made up by financial shares. Add the finance arms of industrial cos. like GE, GM and Ford and some 35-40% of all S&P 500 earnings are made up of purely financial activities. Not exactly happy times there, right now.

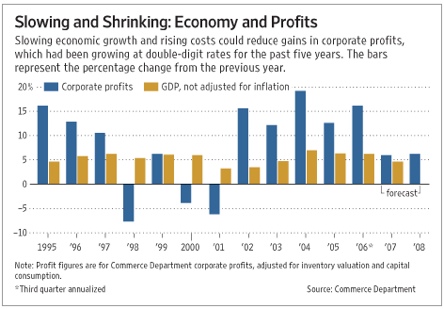
Corporate profits have been able to rise 12% a year since 2002 thanks to robust financial earnings:

Profits Likely to Slow in _07 - WSJ.comGraphic by WSJ.com

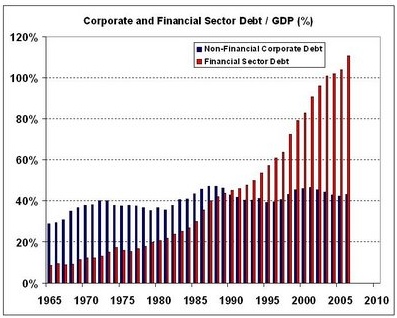
But as the following graph shows, financial companies have used increasing leverage to grow earnings:

Sudden Debt_ The Rabelaisian Growth of Financial DebtGraphic by Sudden Debt

If the current liquidity crisis persists for a while longer, then financial earnings will no longer rise and may actually decline. And I don’t see how the S&P 500 will rise to new highs if its most important sector is contracting.

Increasing My Short Position in Retail Stocks

On Thursday, I decided to up my bet against US retailers by shorting the Retail HOLDRS (AMEX:RTH) ETF at $99.11. The collapse of the housing market and the current credit crisis will soon cause the consumer to significantly cutback on spending. If retail stocks continue to rally, I am willing to further increase my short position.

High-Income Consumers to Rein in Spending

Consumer spending although not robust, has been growing despite the ongoing recession in the residential real estate sector. I have suggested some possible reasons why there is a lag between when the housing bubble started to collapse and when we would see a substantial decline in consumption.

But another important factor which I failed to mention was the healthy spending by high-income individuals who do not concentrate most of their net worth in their homes, like most Americans do, but have significant holdings of bonds and equities in addition to real estate. Therefore, when home prices fall their wealth is not affected as much, and as a matter of fact, the luxury property market has been doing quite well.

Based on the most recent Federal Reserve’s 2004 Survey of Consumer Finances and the BLS Consumer Expenditures in 2005, those in the top 20% of the income distribution hold 91% of common stocks, 91% of non-equity financial assets, but only 65% of real estate equity. And they account for approximately 40% of total consumption.

During the last few years, stocks and fixed income assets had fared quite well and, not surprisingly, the rich have stepped up their consumption as can be seen in the results of high-end retailers. However, the current liquidity crisis has hurt asset prices and if they do not recover quickly, then the wealthy will pull back on their spending.

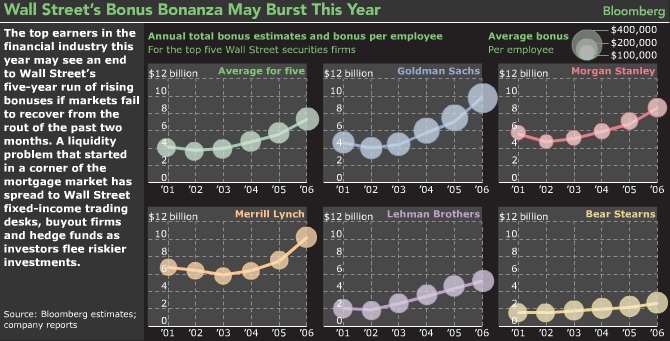
As an aside, Wall Street has been coining money as asset prices have risen in the last few years and employees have been handsomely rewarded. For instance, according to Bloomberg during 2006 the big five investment banks paid out $36.5 billion in bonuses and the 25 best-paid hedge fund managers earned over $14 billion. That is a total of over $50 billion — nearly as large as the GDP of Vietnam, a country with a population of 85 million.

bloomberg

With only a few months left before financial firms begin their year-end payout discussions, it appears as though bonuses will not be nearly as lucrative as they have been in the recent past. I will be paying close attention to the results of Coach (NYSE: COH), Nordstrom (NYSE: JWN), and Sotheby’s (NYSE: BID) in the coming quarters. If their reports indicate that the wealthy have cut their spending, then overall US consumption could suffer an outright decline.

America is a highly indebted economy, which is not an issue if asset prices are rising. But if asset prices stop rising then servicing the debt becomes a problem and spending needs to be curtailed. Wal-Mart’s (NYSE: WMT) recent results show that low- and middle-income consumers are already tapped out. Expenditures from the high-income consumer may be the next shoe to fall.

The World Should Fear a US Slowdown

I am in the camp that believes the US will soon enter a period of economic stagnation or recession, which will significantly cut growth in most parts of the world. To elaborate, I am posting the following excerpt from the recent Quarterly Review and Outlook, Second Quarter 2007 from Hoisington Investment Management:

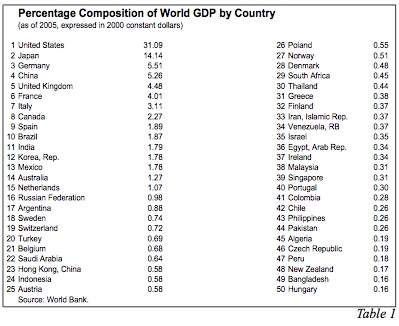
It is incorrect to believe that the rest of the world is strong enough to boost our exports and keep our economic activity on an even keel in the face of a slowdown in U.S. consumer spending. Importantly, real exports constitute only about 11% of economic activity, versus 68% for real PCE. Thus, a massive lift in exports would be needed to keep the economy expanding in the face of consumer retrenchment. However, the statistics and economic history suggest that world growth causality runs from the U.S. to the world, not vice versa. The World Bank provides a breakdown of world GDP in real terms (Table 1).

HIM2007Q2NP.pdf (5 pages)

At present, the world is a mix of rapidly growing and significantly underperforming economies, with the BRIC (Brazil, Russia, India, China) countries on the high growth side and Japan, the United States, and those closely aligned with the U.S. on the slow side. The rest are largely somewhere in between these strong and weak groups. The United States accounts for 31% of world GDP with Japan next in line with 14.1%, meaning these two countries account for 45.2% of total world output. The BRIC countries, on the other hand, control 10% of global output. Although Mexico and Canada diverge from the United States over shorter intervals, over the long run they are tied to the fortunes of the United States. Adding those figures to the United States and Japan boosts the total to 49.3% of global GDP, a figure that easily rises to about 50% if one takes into account the Latin American countries influenced more by the United States than any other country.

But even this analysis is not a complete description of the impact of the United States on the global economy. A main source of Chinese growth is their burgeoning trade surplus, most of which is with the United States. According to official Chinese figures, the Chinese had a record trade surplus for the first half of this year of $112.5 billion, with $73.9 billion or 65% with the United States. U.S. records indicate that its deficit with China is bigger than the official Chinese figures show. The boost to Chinese GDP is even greater when one takes into account the foreign trade multiplier, or indirect economic effects. It then becomes clear that the Chinese trade surplus against the U.S. has been a powerful stimulant to their economy. They will indeed feel the slowdown in U.S. consumption. The U.S. trade deficit also plays a major role in domestic economic growth for India and Brazil, not to mention Europe.

Econometric studies provide important insight into the global impact of the U.S. economy. These studies have shown that U.S. imports increase $2 for each $1 rise in income, but that U.S. exports go up just $1 for each $1 gain in foreign income. Thus, when U.S. consumption is accelerating the world economy is a major beneficiary, but when it slows, as it is now doing, the rest of the world will lose forward momentum. This relationship explains why U.S. domestic demand leads the domestic demand in the large foreign economies by six to nine months (Chart 3).

HIM2007Q2NP.pdf (5 pages)-1

In the second quarter real domestic final sales slumped in the United States and U.S. imports fell, aligning with the econometric studies. Industrial production has contracted for three straight months in Japan, and Germany registered a net decline over the past two months. Thus, the process of transmitting U.S. weakness to the rest of the world has begun.

Investors holding foreign stocks hoping for protection from a US economic contraction might be disappointed.

Repositioning My Portfolio After the Sell Off

Thursday saw major declines in US stocks, which at one point had the S&P 500 down 10% from its 52-week high — a threshold defined as a market correction. This was the first correction in 52 months and the end of the second longest streak since World War II. However, Thursday afternoon the markets recovered and further recouped losses on Friday after the Fed announcement that the discount rate had been cut by 50 basis points.

The reduction in the Fed’s discount rate is simply a confidence restoration measure since it is still half a percent greater than the fed funds rate and discount window lending is only available to depository institutions, who are not the ones suffering from illiquidity. Nonetheless, the Fed is clearly shifting to an easing bias and will likely reduce the fed funds rate if there isn’t much improvement in the credit markets. So now that we got the long overdue 10% correction out of the way and with the Fed setting the stage for a cut to the funds rate, it would seem the markets have put its worst days behind it. However, I am not convinced.

First, significant downside risk remains to asset prices because although central banks have been providing funds at lower than market rates, there is no guarantee that this will immediately reduce recent investor risk averseness. It has barely been a month since the start of the sell off and it is reasonable to assume that most funds will hesitate to increase leverage until the almost daily flow of headlines of fund blowups wanes.

Second, the unwinding of the yen carry trade may not have ended yet. Last May and June the unwinding forced the yen to appreciate to as high as 110 yen per dollar or about 4% more from where the rate trades currently. The yen is probably around 30% undervalued compared to the US dollar based on long term monetary inflation rates and purchasing power parity. The yen can easily rise to 100 per dollar over the next few quarters as the rest of the world lowers interest rates to stimulate growth and brings them closer to Japan’s. Such a rapid appreciation will diminish the attractiveness of the carry trade and put downward pressure on asset prices.

Third, the US consumer is tapped out and will reduce spending in the coming quarters. The trade deficit has been the biggest source of global liquidity because the dollars earned by foreigners are mostly invested in US assets which stimulates credit expansion in both the US and the exporter’s country. Assuming energy prices don’t rise, the trade deficit should improve. Moreover, an environment of declining consumer spending will hurt corporate profits and make equity valuations look expensive.

An early August Merrill Lynch survey of global fund managers showed that just 7% believed that a global recession is likely in the next 12 months, with most regarding the current turmoil as a buying opportunity. Not surprisingly, Street economists expect tightening credit to hurt consumer spending — but they’re still penciling in economic growth near 2%. Until economists and analysts cut their forecasts for economic and corporate profit growth to around zero, I can’t get bullish on stocks.

The US economy is highly leveraged and an extended period of deflation would be catastrophic. To prevent this, the Fed will surely inflate the money supply to the extent that is needed to counteract credit contraction. That will lead to a weaker US dollar, soaring consumer prices, disappointing equity and fixed income returns (in real terms), and a much higher gold price.

That said, although base metals prices declined along with other assets, they are still grossly overvalued, and I find it hard to be an aggressive buyer of gold as long as this remains the case. Many funds which speculated by buying gold along with copper, nickel, zinc, etc. may decide to sell gold along with the other metals to raise cash if any of the risks I outlined are realized. I did add to some of my gold positions during Thursday’s steep sell off, but I wouldn’t describe my buying as substantial.

I covered most of my short positions in base metals stocks and U.S. Steel (NYSE:X) on Wednesday and Thursday. I was up 25-35% on most of the shorts and they served their purpose of hedging my junior gold stocks which were hit hard. If base metal stocks rally from here, I will go short again. My remaining short positions are mostly in retailers. I am also keeping 30% of my portfolio in cash in case my favorite stocks get cheaper.