Author Archives: Administrator

How Big is the Bubble in Chinese Stocks?

To get a sense of how big China’s current stock market bubble is, I have gathered some facts reported by Bloomberg:

  • The Industrial & Commercial Bank of China (ICBC) has a $285.2 billion market value that trails only Exxon Mobil and General Electric. That’s much bigger than Citigroup’s $233.8 billion market cap, despite ICBC’s 2006 earnings of $6.5 billion equal to less than a third of Citigroup’s.
  • The CSI 300 Index trades at a PE ratio of 50 compared to the S&P 500’s 17.
  • One estimate accounts trading by individual investors for 60% of market volume. In the US, individuals account for only 5% of total trading.
  • The CSI 300 has risen 14% since July 23, the day before the credit markets sparked a sell off in global equities. The S&P 500 is down 7% since then.

It is clear that the Chinese stock market is an enormous individual investor driven bubble that makes US stocks looks dirt cheap in comparison. A trade I wish I could make would be to short the CSI 300 and go long the S&P 500. However, this is not possible since the CSI 300 contains yuan-denominated A-shares of companies listed in the Shanghai and Shenzhen exchanges which can’t be traded by foreigners.

One could instead trade the same companies listed in Hong Kong and Singapore, but according to Bloomberg calculations on June 11th, the A-shares are priced at a 54% and 65% discount on the Hong Kong and Singapore exchanges, respectively. This makes the valuation on Chinese shares much less expensive and the trade unattractive.

So while it is obvious that the mainland share prices will eventually crash, it is less obvious how to profit from it. Currently, the only action I can take is to sit back and watch it unfold.

Shorting Retailers

I am currently holding a significant short position in retail stocks because I believe consumer spending is beginning to falter. The housing recession, which began with the collapse of homebuilding stocks, has started to spill over to rest of the economy as can be seen in the recent troubles of financial stocks. The next shoe to drop maybe the shares of retailers.

My favorite shorts are Black & Decker (NYSE:BDK) which depends on a strong housing market; Dick’s Sporting Goods (NYSE:DKS) which depends on healthy discretionary spending; and Target (NYSE:TGT) which has so many stores that they will not be able to grow profits in the face of a general slowdown in consumer spending.

Closing My Short Position on the Brokers

In August of last year, I mentioned my initiation of short positions on Bear Stearns (NYSE:BSC) and Lehman Brothers (NYSE:LEH), two investment banks which had profited handsomely from the abundance of liquidity in the financial system.

Both stocks continued to perform well for the next few months, at which time I decided to double down on my short position. It was not until February that the problems I were looking for in the brokers began to catch the attention of the market. I have now decided to close my short position in both stocks with around a 20% gain.

A Credit Crunch in a Highly Leveraged Economy

The collapse of the subprime mortgage market has caused fixed income investors to demand higher risk premiums from not only all grades of residential mortgage-backed securities, but also commercial mortgage-backed securities, corporate bonds and debt from emerging markets.

Treasury yields, on the other hand, have been declining due to a flight to “quality” creating wider interest rate spreads. However, as the following graph shows, spreads are still low by historical standards:

High Yield SpreadsSource: Bear Stearns

But I am still worried because a record amount of non-government debt is required to create each unit of GDP.

US Debt to GDPSource: Federal Reserve

Therefore, rising interest rates can induce a monetary contraction that can have a bigger impact on the economy than in the past. This is why the current credit crunch should be closely watched.

The LBO/Private Equity Party is Coming to an End

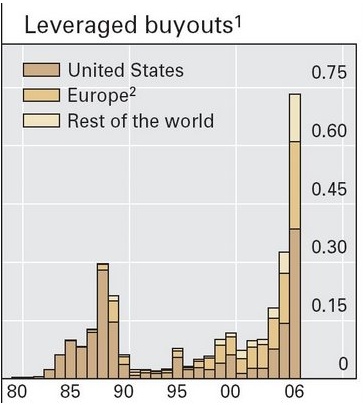
As the following graph shows, LBOs have surged in recent years:

LBOs

(Announced value of all deals, including net debt; in constant 2005 US dollars; based on the date of the announcement and the residency of the target firm.)
Source: Bank of International Settlements 2007 Annual Report

Blogger Sudden Debt points out:

In 2007 thus far, global LBO’s are running at a rate 33% higher than 2006. So, it looks as if we may easily surpass $1 trillion in LBO activity this year – assuming the current rate is maintained. Total global market capitalization was $55 trillion as of May 2007; withdrawing almost 2% of market value in one year does wonders for stock prices.

However, there is an absurdity lurking here: private equity and LBO firms are taking dozens of listed companies private, but they are going public themselves. The whole process does not make any sense at all: we are being asked to pay a premium over and above what the LBO firms paid themselves in order to end up owning the same assets. It is little wonder that their IPO’s are not faring well, so far.

Add the recent widening of credit spreads which is raising borrowing costs (e.g. the CDX High Yield index has jumped from 275 bp to 455 bp in the past 45 days) and we may already have seen the peak of the LBO activity, which translated into high takeover premiums being placed on stock markets.

The underwriters of the $20 billion of Chrysler debt — JPMorgan, Citi, Goldman Sachs, Bear Stearns and Morgan Stanley — could not sell the $12 billion portion of the deal tied directly to the Chrysler auto business. The banks have agreed to take on $10 billion of the $12 billion portion of the loans, while Cerberus and DaimlerChrysler will lend Chrysler $2 billion to complete the financing.

In Europe, Deutsche Bank is the lead arranger of the loan deal to finance KKR’s buyout of U.K.-based drugstore chain Alliance Boots. According to a Bloomberg report, it and other banks involved were unable to sell $10 billion of loans out of a total $12 billion to finance the buyout.

The black eye comes as the banks and their Wall Street rivals have belatedly sought to rein in their exposure to risky debt. According to sources in the markets, banks have cut back funding to collateralized debt obligations that buy mortgage debt, and increased their collateral requirements for lending to hedge funds.

Issuance of CLOs soared to a record $57 billion in the first half of 2007. That has since slowed to a trickle. So far this month, just $1.9 billion of CLOs have been sold, according to Standard & Poor’s Leveraged Commentary & Data.

This comes at a critical time, because banks are in the process of selling more than $200 billion of loans to investors. CLOs have been big buyers of those loans, now many of them aren’t getting sold.

Last month, the near-collapse of two hedge funds managed by Bear Stearns rattled the corporate debt market. The funds made big bets on subprime mortgage-backed securities, but also held some CLOs, which were offered for sale as the hedge funds’ assets were being liquidated. It isn’t clear if the CLOs were actually sold, but the prospect of a fire sale spooked some investors and made them reassess their appetite for riskier corporate debt.

LBOs were profitable in recent years due to low borrowing costs and strong corporate profits. With interest rates on risky debt rising, borrowing has suddenly become much more expensive for private equity firms. But the nasty surprise will come when consumer spending continues to deteriorate leading to a decline in corporate profits. That is when the LBO bubble will turn into a bust.

What’s Behind the Credit Worries?

The Economist explains what’s behind the fear of a liquidity contraction that shook the markets today:

Calling it a credit crunch might be an overstatement. But it does look like a credit squeeze. In recent years, investors’ enthusiasm for high-yield products has allowed borrowers free rein in the debt markets. Blessed by strong profits and buoyant economic conditions, companies seemed more than capable of paying back their debts; default rates have been remarkably low.

Indeed, such was the power of borrowers, private-equity groups chief among them, that they were able to dispense with the market’s traditional safeguards. They dropped some of the covenants that gave lenders the right to act if the borrower’s finances deteriorated.

Suddenly, however, investors are turning their noses up at some deals. Banks that had lent large sums to finance the buy-out of Chrysler, the car giant, and AllianceBoots, the drugs retailer, had hoped to sell these loans to an eager market. This week both debt sales were postponed in the face of sniffy investors. A similar sale to fund the buy-out of US Foodservice, a food distributor, was scrapped last month. Even before the latest news Baring Asset Management counted 28 corporate-bond or loan deals, worth around $17 billion, that had been pulled since June 22nd.

What has prompted this change of heart? Many point to the problems in the American subprime-mortgage market, where defaults have risen and several hedge funds have been wiped out in the process. Countrywide, a mortgage bank, has triggered further concerns by admitting that bad-debt problems are now spreading to conventional loans.

When investors suffer losses in one part of their portfolio they get nervous about potential problems elsewhere. On July 20th the European crossover index, which covers riskier corporate debt, suffered the worst day in its short history. The spread (excess interest rate) over government bonds widened by two-fifths of a percentage point.

Investors may also be suffering from indigestion. According to Moody’s, a rating agency, nearly $1 trillion was raised in European credit markets in the first half of the year. Greg Peters, a Morgan Stanley strategist, says that $57 billion of bonds and more than $200 billion of loans are already in the pipeline: a plentiful supply of debt to absorb the potential demand.

It is hardly surprising, therefore, that investors have decided that higher yields are needed. This has caused a temporary hiatus as issuers get used to the new regime. But it looks more like a return to normality than a buyers’ strike. Credit-default swaps (which insure investors against a failure to repay) reflect this shift in sentiment. Jim Reid, the credit strategist at Deutsche Bank, says swap spreads in the European high-yield market are now wide enough to compensate for the average historic default rate. In America spreads are well above that level.

Pushing spreads further might require some actual defaults. That, in turn, would probably require the global economy to weaken significantly. At the moment, however, economists seem pretty sanguine, forecasting output growth of 2.7% for America in 2008 and 2.3% for both the euro area and Japan.

A benign view of the economic outlook may be why the Dow Jones industrial Average recently passed the 14,000 level for the first time. But stockmarkets have shown signs of concern at developments in the credit markets; their latest wobble was on July 24th.

Some of the fundamental supports for equities are being eroded. In America, corporate profits are on course to grow by 5.5% in the year to the second quarter, a long way below the double-digit rises to which investors have grown accustomed. The proportion of firms beating expectations in the second quarter was at its lowest since late 2002. By the measure derived from America’s national accounts, profits fell in the fourth quarter of 2006.

And the takeover boom may be near its peak. “The tide appears to be going out for leveraged equity financiers,” says Bill Gross of the bond giant Pimco. Bids have become more expensive to finance while share prices have been rising. Citigroup says that, in mid-2005, the corporate-bond yield was 4.4% and the trailing earnings yield on European equities was 6.8%. That made it highly attractive to issue debt to buy shares. But by mid-July the bond yield was 6.1% and the earnings yield 6.3%, a much less attractive trade.

Predators can be inventive in finding sources of finance for their deals, as Barclays has shown. At the margin, however, bids are becoming harder to pull off. The banks are now stuck with the risk of the AllianceBoots and Chrysler deals. They won’t want to make that mistake again.

I am betting that this is just the beginning of a substantial rise in risk premiums.

Consumer Spending is Beginning to Falter

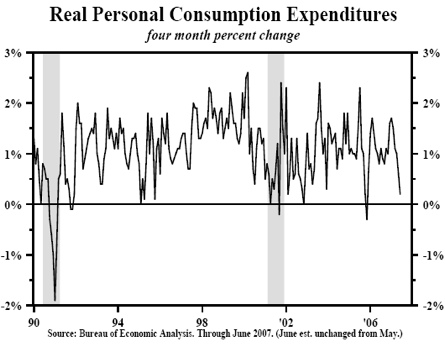
Excluding the decline in consumer spending during the second half of ‘05 due to hurricane Katrina, consumption has been the weakest since 2002. As depicted by the following graph, real personal consumer expenditures (PCE) has been nearly flat over the last four months:

Real PCE till Q2 2007

I believe that consumer spending would come under pressure as soon as the housing bubble popped. Despite plummeting home sales and stagnating home prices during most of last year, consumer spending did not immediately suffer. Why? I have three explanations:

  1. There is a lag of several months between when businesses begin to struggle and when they actually layoff workers. So the hundreds of thousands of construction, lending and realtor jobs created during the housing boom are only beginning to be reduced. Non-farm household employment, an alternative jobs measure that historically has been more accurate at cyclical turning points, expanded 45,000 per month this year compared to a 235,000 average monthly gain in 2006, an 80% decline.
  2. Mortgage equity withdrawals (MEW) represented over 5% of personal disposable income until this year. With tighter lending standards, higher interest rates, and falling home prices you can bet that MEW will fall even further.
  3. Real personal disposable income grew by 2.6% last year after rising by only 1.2% in 2005. For the first 5 months of this year, real disposable income has increased by only 0.5%.

Add to all this the rise in food prices, gasoline prices, and interest rates, and the sluggish PCE and sales that retailers have been reporting lately may be the beginning of a more protracted downturn in consumer spending, which represented about 68% of US economic activity during the first quarter. My forecast of a 2007 recession still looks possible.

The Birth/Death Ratio’s Impact on the Jobs Data

I no longer pay much attention to the BLS monthly employment reports because it later is often significantly revised by which time the report is useless as a forecasting tool. John Mauldin explains how the BLS is currently overstating employment numbers:

To start with, let’s dissect the employment numbers. The official headline number for June was 132,000 new jobs. Since we need about 150,000 new jobs just to stay even with population growth, that is hardly a robust number, but not too far off from what would be a good number. Except that there are some problems with the headline number.

The employment numbers come from a survey of established businesses. But obviously the Bureau of Labor Statistics (BLS) cannot call every business in the US, so they simply survey the larger businesses. But that means they miss the growth in the small-business sector of the economy, which is where the largest amount of new jobs are created.

The BLS surveys about 160,000 businesses in its sample model. There is an unavoidable lag between an establishment opening for business and its appearing on the sample frame and being available for sampling. Because new firm “births” generate a significant portion of employment growth each month, non-sampling methods must be used to estimate this growth. To make up for this, they add or subtract a certain number of jobs, called the birth/death (of new businesses) ratio.

They use the actual births and deaths of real businesses for the last five years to make their estimates of new jobs created from new business. This is quite a legitimate methodology, but it does have one problem. It is backward-looking data. BLS knows that and states the following on its web site:

“The most significant potential drawback to this or any model-based approach is that time series modeling assumes a predictable continuation of historical patterns and relationships and therefore is likely to have some difficulty producing reliable estimates at economic turning points or during periods when there are sudden changes in trend. BLS will continue researching alternative model-based techniques for the net birth/death component; it is likely to remain as the most problematic part of the estimation process.”

Remember the jobless recovery of the first Bush term and the constant criticism about the poor economy? Why was the economy doing so well and yet job creation was so poor? It turns out that a great deal of the explanation is that the BLS underestimated the number of new jobs being created by small business. In the early years of the recovery, rather badly.

Likewise, the BLS data will overestimate jobs when the economy is slowing down. Is there some evidence that may be the case today? I think there is.

To the credit of the BLS, they are very transparent about their data. There are massive amounts of data available at www.bls.gov and the data on the birth/death ratio is at http://www.bls.gov/web/cesbd.htm. Now, let’s examine the contribution of the birth/death ratio to the employment numbers.

Last month, the BLS estimated that there were 156,000 new jobs in the birth/death ratio category, which was 24,000 more jobs than they estimated were created for the month. OK, maybe no problem. Looking back over five years, the economy has created about that many new jobs during the month.

Except that they estimated 26,000 new small-business construction jobs. With home construction dropping, do we really think that the same number of new jobs was created in construction as in June of 2006 and 2005? Or that 153,000 new jobs in small-business construction have been created this year? Really?

In fact, since January, the BLS estimates for the birth/death ratio have added 747,000 new jobs of a total projected growth of 871,000 jobs, or 86% of the total of the jobs estimated supposedly created for the first half of the year.

Is there any other reason to believe that the birth/death ratio may be overstating employment as the economy slows? The always astute Paul Kasriel of Northern Trust thinks there is. He notes that in 2005 the contribution of the birth/death ratio (12-month average) to the overall employment numbers was well under 35%. Today it is over 56%. Given the recent numbers, that ratio is likely to rise.

“What has been happening to the relative contribution of birth/death estimates as the economy has slowed in the past year? The chart below shows that it has been rising. In the 12 months ended March 2006, the birth/death adjustment was contributing only 30.9% of the jobs to the change in nonfarm payrolls. The birth/death relative contribution has been trending higher since then. Notice that as the birth/death contribution to nonfarm payrolls has been trending higher, the percentage of small businesses saying that now is a good time to expand their operations has been trending lower. If existing small business managers do not think now is a good time to expand their operations, does it make sense that there are a lot of new small businesses starting up and hiring?

“Perhaps because the birth/death adjustment is not, itself, adjusted for the phase of the business cycle the economy is in, it is biasing upward the growth in nonfarm payrolls now. Perhaps the birth/death adjustment is the answer to the Fed’s latest conundrum with regard to stronger-than-expected payroll growth given the sharp slowing in real GDP growth.”

The number of unemployed rose by 114,000 in June, as both the labor force and population rose. That does not sound robust to me. That seems to call into doubt the recent numbers.

I have another reason for doubting the jobs data. If employment growth is decent, than why are real wages falling this year?