Another Yuan Revaluation Imminent

Recently the yuan has picked up its pace of appreciation against the U.S. dollar. Over the past week, the yuan has appreciated by 0.5% against the dollar and its current rate of 7.90 is the highest since its revaluation in July of last year. I believe this is setting up the stage for another revaluation before the end of the year.

Senators Charles Schumer and Lindsey Graham had planned to introduce legislation that would impose a 27.5% tariff on Chinese exports to the U.S. After meeting Treasury Secretary Henry Paulson they said they may delay pushing a vote for the time being. What could Mr. Paulson have said to them to have caused their shift in position? I believe the Treasury Secretary has received assurances from Chinese officials that they will soon revalue the yuan again.

China no doubt, understands the consequences of the proposed tariff. If it keeps the exchange rate fixed they would have to pay 27.5% of the value of its exports to the U.S. government. On the other hand, if China was to revalue its currency by 27.5% it would not have to pay tariffs to the government and the costs of its imports would decline by 21.4%. The impact on demand for Chinese goods under both situations would be equivalent. Obviously, China is better off revaluing.

China realizes that if they do not cooperate with the U.S. the legislation will eventually get passed and, therefore revaluing the currency very soon is their best option. I don’t expect the yuan to be revalued by 27.5%, but it will be more significant than the last revaluation.

The Coming Bear: Severe Recession (Part 3)

I will build on my conclusions from the first two parts of this series to analyze where the economy is headed. In the first part I discussed why interest rates are heading higher. As a consequence, in the second part of this series I argued that the housing market will experience falling prices. If my predictions turn out to be correct, the economy will suffer a recession that would be even more painful than that of 2001.

What Recession?

The 2001 recession was relatively short and mild compared to those in the past. As the economy contracted, President Bush provided stimulus by introducing legislation that cut taxes while simultaneously increasing spending on social programs and defense.

The economy also received a boost when the Federal Reserve rushed to cut rates to an unprecedented level of 1%. At the same time China entered the WTO and U.S.-China trade exploded. Since China wanted to maintain the yuan’s peg to the dollar, they were forced to use their surplus dollars to buy U.S. investments, in particular bonds which caused both short and long-term rates to fall.

Historically low rates spurred consumers to take on record debt which was used to buy things like plasma TV’s, SUV’s, stocks, and especially houses. As the demand for housing outstripped supply, prices started to rise at an unusually high rate. When the value of peoples homes increased it caused their wealth to also increase even though their wages saw no improvement during the same period. This wealth effect contributed to further consumption and home equity extraction.

The Housing Effect

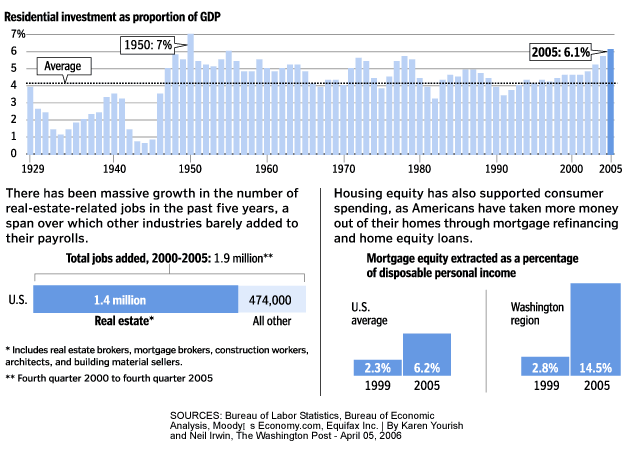
Since 2001, manufacturing has been replaced by housing as the main engine for economic growth. As the following graphic shows, the booming housing market’s impact on the economy cannot be overstated.

housing_impact_economy

However, as I concluded in the previous part of this series housing is overvalued and prices will decline over the coming few years. Such a scenario would devastate the economy. Dean Baker estimates that a contraction in housing activity could shave 3 to 4 percent off GDP.

Housing construction is equal to approximately 5 percent of GDP. Construction of new homes has been going on at a near-record pace over the last few years, in response to the run-up in housing prices. Home construction could easily fall back 40 percent (this was the drop off in the 1981-82 recession), which would imply a direct loss in demand equal to 2 percentage points of GDP.

In addition, the large wealth effect associated with the housing bubble, which has spurred a consumption boom in the last few years, will go into reverse as housing prices plummet. Research from the Federal Reserve Board shows that a dollar in additional housing wealth leads to 4 to 6 cents of annual consumption. This implies that a loss of $5 trillion in housing wealth would lead to a decline in annual consumption of between $200 billion and $300 billion. This loss in consumption is equivalent to 1.6 to 2.5 percentage points of GDP.

Combining the 2 percentage point drop in demand due to a falloff in housing construction with the 1.6 to 2.5 percentage point drop in demand due to the reversal of the housing bubble’s wealth effect leads to a falloff in demand of between 3.6 and 4.5 percentage points of GDP. If employment fell in the same proportion, this would imply the loss of between 5.0 million and 6.3 million jobs.

Since recent data is indicating a hard landing for housing, I am expecting that we will see a recession in 2007. This time Fed rate cuts will not save the economy since foreigners will put upward pressure on long rates. In addition, the government will be handcuffed to provide fiscal stimulus since it is already running unsustainable budget deficits. Therefore, the upcoming recession should be far more painful than the last economic contraction and it could turn out to be as bad as Japan’s recent experience.

The Bond Rally May Be Ending Soon

Treasuries are on pace for the largest weekly advance in 17 months. The 10-year yield has fallen to 4.6%, the lowest level since March.

ten_year_yield

I considered buying bonds during the spring as a short-term trade, even though I am bearish in the long-run. My rationale was that the economy was weaker than investors believed and disappointing economic data coupled with the Fed pausing its rate hikes would make bonds attractive. Furthermore, all other assets, including gold, looked overvalued and bonds would be a good place to park some cash until gold corrected.

Since then bonds have significantly rallied as the market realized that the economy is slowing and the Fed is ending its tightening campaign and may even soon cut rates. Gold has also corrected by 19% since its May high. At this point, bonds look a lot more risky to me though I would not be surprised if they continue to rally as the economy enters a recession next year.

My main fear is that foreigners, the largest holders of privately owned government debt, will eventually reduce their holdings causing rates to shoot up. Reading comments like those made recently by a UAE central banker, lead me to believe that its only a matter of time before rates start to increase again.

Stats Indicate Hard Landing for Housing

Take a look at some recent housing numbers collected by Comstock Partners:

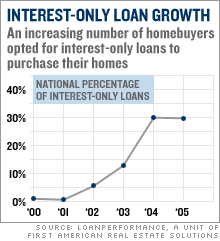
  • 32.6% of new mortgages and home equity loans in 2005 were interest only, up from 0.6% in 2000
  • 43% of first-time home buyers in 2005 put no money down.
  • 15.2% of 2005 home buyers owe at least 10% more than their home is worth.
  • 10% of all home owners have no equity in their homes
  • $2.7 trillion in loans will adjust to higher rates in 2006 and 2007.
  • 70% of borrowers who took out pay-option ARMS in the past year have loan balances larger than their initial loan.
  • Homeowners  face higher payments as mortgages are reset. Generally, monthly payments rise between $200 and $500 depending on the size of the mortgage.
  • According to Reality Trac, August foreclosures were up 23% over July and 53% over a year ago.
  • The number of homes for sale is at record highs, and inventories are 59% higher than a year earlier.
  • New home sales are down 22% and existing home sales down 11%.
  • The NASB housing market index has recorded an all-time decline.
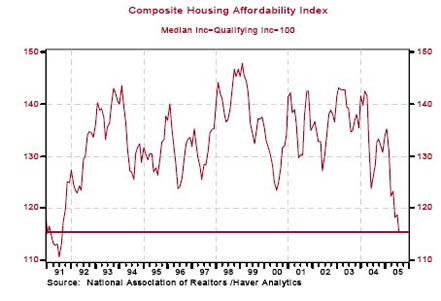
  • The housing affordability index is at a 15-year low.
  • The house price-to-income (rents) ratio is off the charts. According to HSBC, in 18 states accounting for over 40% of national home values, the price-to-income ratio is 3.6 standard deviations above the mean.
  • The OFHEO index of house prices deflated by the consumption price deflator has soared to a record high of 350 from 250 in 2001. From 1976 to 1996 it never was above 220.
  • According to the NAR the year-to year prices of existing homes are now flat. A short time ago they were rising at a yearly rate of 16%.
  • Nationally, home prices have not declined on a year-to-year basis since 1933. Recently, however, prices have been dropping in the North East, West and Mid-West.
  • Sales incentives are now estimated at 3% to 7% of selling prices.

These are ugly stats and lead me to believe that housing is in for even tougher times ahead.

The Coming Bear: Real Estate Bust (Part 2)

In the first post of this series, The Coming Bear, I looked at interest rates and explained why I think they are heading higher. With that in mind let’s take a look at the housing market which has been the engine of growth for the economy in recent years — I will discuss how important the housing boom was on the economy in Part 3 of this series.

The Creation of the Housing Bubble

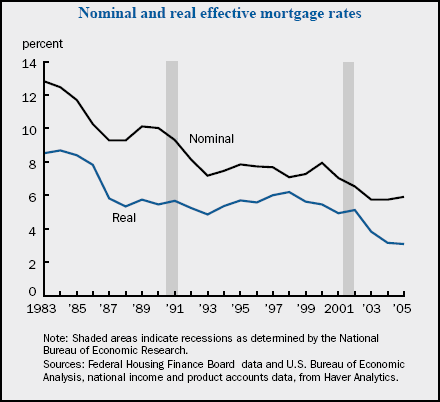
Many contend that the housing bubble was inflated due to the Federal Reserve lowering the funds rate from 6.5% in January 2001 to 1% in June 2003 — a level not seen since 1958 which was maintained until June 2004 when rates were hiked. This pressured mortgage rates to fall to levels not seen in fifty years.

Even during the Fed’s subsequent hiking campaign, mortgage rates continued to decline — most likely due to the Chinese and Japanese purchasing hundreds of billions of dollars worth of bonds which completely offset the Fed’s efforts to cool down the mortgage market. It should also be noted that real mortgage rates have continued to fall recently even though nominal rates have started increasing due to inflation concerns.

mortgage_rates

The fall of the Nadaq by 70% during 2000-01 also helped the housing sector since it caused many tech investors to shift their funds and trading mentality to real estate which they considered to be a risk-free investment. According to Robert Shiller:

Once stocks fell, real estate became the primary outlet for the speculative frenzy that the stock market had unleashed. Where else could plungers apply their newly acquired trading talents? The materialistic display of the big house also has become a salve to bruised egos of disappointed stock investors. These days, the only thing that comes close to real estate as a national obsession is poker.

Another factor that propelled the housing bubble was the deterioration of mortgage lending standards. According to the RealEstateJournal:

Investment banks and other firms have been buying mortgage loans from lenders and packaging them into securities for sale to investors since the 1980s. But investor demand has surged in recent years, largely because in an era of low returns, mortgage-backed securities offer yield-starved investors much higher returns than government bonds.

Investors’ strong demand for mortgage debt, besides allowing lenders to offer many borrowers better terms, has also made it easier to offer mortgages to borrowers who might not easily qualify for a loan. The growth of the mortgage markets spreads the risks around. But some mortgage-industry analysts say lenders have become less stringent in their loan terms because they can sell almost any type of loan to those who package mortgage securities for investors.

“Loose lending standards are probably the single biggest thing fueling the speculative fever we have today” in housing, says Kenneth Rosen, an economist who is chairman of the Fisher Center for Real Estate at the University of California at Berkeley.

The buyers of these mortgage-backed securities include hedge funds — who use the “carry trade” to borrow at low rates — and Asians, specifically the Chinese and the Japanese — who seek to diversify their foreign reserves away from Treasuries.

Proof that increased demand for mortgage-backed securities are leading to a loosening of lending standards can be seen in the growth of “exotic” mortgages such as interest-only loans.

interest_only_loan_growth

Why the Housing Bubble is Unsustainable?

It is unlikely that Americans can continue buying houses at the same pace. First, house prices have risen too much for most people to afford. The NAR’s latest housing affordability index level of 102.8 is at a 15-year low.

HousingAffordability

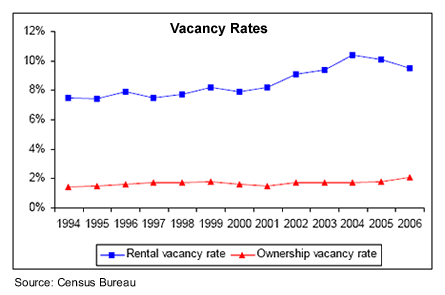
Second, rental vacancy rates hit record levels in 2004 causing rents to fall relative to home prices. This has made renting more attractive to potential homebuyers.

vacancy_rates

Third, interest rates are likely to increase due to reduction in bond purchases from China and Japan. As a by-product, the decrease in demand for mortgage-backed securities will cause lenders to tighten their lending standards.

The Bubble Has Already Popped

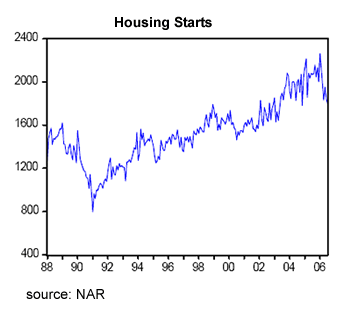
Recent data suggests that the party is over in the housing sector. Over the last 12 months, housing starts were down 13.3%, existing-home sales were down 11.2% , median home prices were up only 0.9% (down in real terms), 30-year mortgage rates were at 6.52% up from 5.70%, and housing inventory levels are up 3.2% in July from June’s levels which represents a 7.3 month supply at the current sales pace.

housing_starts

How Much Will Prices Fall?

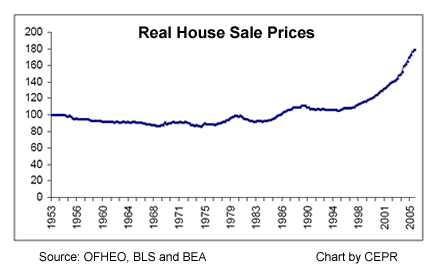
Until the mid-nineties home prices hardly ever increased in real-terms. Robert Shiller estimates that house prices in America rose by an annual average of only 0.4% in real terms between 1890 and 2004. But since 1995 it has increased by 50%. Therefore, over time mean reversion suggests that real prices should fall by around 50%.

real_house_sale_prices

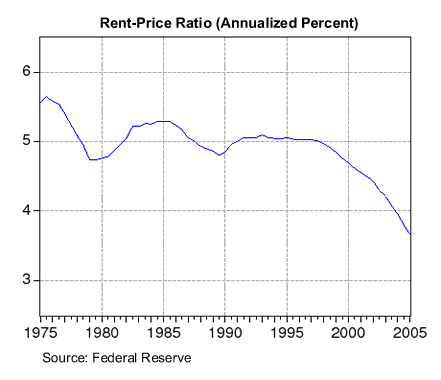
Looking at the price-to-rent ratio for homes — which is a similar valuation metric as the price-to-earning ratio used for equities — indicates that the ratio is about 50% higher than its long-term average. Most likely in the future we will see both an increase in rents and a decrease in prices.

rent_price_ratio

My own expectation is for home prices to fall by around 50% in real-terms over the next 5-10 years. Prices should fall more on the coasts where homes benefited more from the bubble. Since markets tend to oscillate between being overvalued and undervalued, I expect the upcoming real estate bear market to produce some terrific deals. I personally plan to keep my powder dry until then in order to buy a nice beachfront property that will probably still be selling at today’s prices.

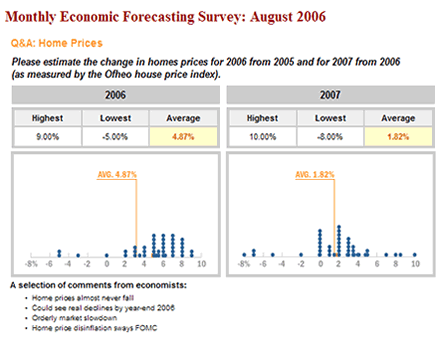
To get a sense of how uncommon my expectations are for the housing market, I need to look no further than Wall Street economists. The WSJ’s economics forecasting survey for August showed that economists on average are expecting housing prices to increase by 4.87% in 2006 and 1.82% in 2007.

august_homeprice_forecast_wsjSource: WSJ.com

I think the economists are overly optimistic — my own forecast is for nominal house prices to increase by no more than 2% this year and drop in 2007. That is, real prices will fall this year and continue falling for the rest of this decade.

Shorting the Brokers

Earlier this month Marc Faber caught my attention for predicting that the stocks of brokers are set-up for a fall similar to the stocks of the home builders 12 months ago. An article in yesterday’s Barron’s discusses this idea in greater detail;

NOW MIGHT BE A GOOD TIME TO RING UP THAT BROKER who put you into Ford shares two years ago and let him know his best days are probably behind him.

Following a remarkable four-year run that’s more than doubled the value of some Wall Street brokerage stocks, analysts have begun to pare earnings numbers amid worries that slower economic growth and higher rates have substantially increased the risks for this high-flying cyclical group that includes Bear Stearns (ticker: BSC), Goldman Sachs (GS), Lehman Brothers (LEH), Morgan Stanley (MS), Merrill Lynch (MER) as well as global financial conglomerates like Citigroup (C) and JPMorgan Chase (JPM).

The brokers are victims of their own success. Results have been great in all of their most important business lines, including equities, mergers and acquisitions, asset management and private equity. The firms’ prime brokerage services, which mainly serve hedge funds, have thrived, and improved markets have spurred record proprietary trading gains. Even fixed-income profits in areas like mortgage securities have held up despite the Federal Reserve’s interest-rate hikes.

“There’s nothing that can get better. Every cylinder has been firing away,” contends Charles Peabody, an analyst at Portales Partners, a New York financial-services research boutique.

Peabody is among those who believe a more hostile environment won’t allow the brokers to jump from success to success much longer. The Fed’s tighter monetary policy has drained liquidity from U.S. markets and central banks around the world have started to follow the same path. As funding gets more expensive, investors’ appetite for risk will decline, making it tougher to underwrite profitable equity and debt offerings or to continue Wall Street’s incredible streak of trading gains.

No doubt rallying stock and bond markets would continue to bolster brokers’ shares, but the odds against that occurring seem to be growing. The bottom line, says Peabody, who rates the brokers a Sell: “I think you could have earnings drop 30% next year.” That presumably would take a commensurate chunk out of the stocks.

Brian Rauscher, director of portfolio strategy at Brown Brothers Harriman, also has a Sell recommendation on the group because he believes their relative-earnings-estimate revisions have peaked. In other words, the group’s earnings aren’t going up as quickly as they had in the past. And, before this cycle ends, Rauscher believes, earnings estimates will start to get cut.

A quick reversal of fortune is possible if private-equity gains slow or margins in the prime brokerage business get skinnier because of increasing competition. A housing-industry slowdown could dramatically reduce the production of new mortgages, leaving some firms with bloated overheads. And if the recent stock-market rally turns out to be a bear-market bounce, the summer doldrums that have depressed equity underwriting volumes could extend into the fall.

The dollar value of initial public offerings in the U.S. for this summer is down 49% this year and the number of IPOs is down by 52%. Similarly, the value of IPOs worldwide is off 9% and the number is down 25%, says Thomson Financial. The decline not only hits underwriting profits but also makes it more difficult for private-equity shops — including those within Wall Street firms — to exit their investments via IPOs.

The flood of money into private equity (see Eliminate the Middleman) may ultimately shrink returns in one of Wall Street’s most profitable areas. Private-equity investments have boasted returns of 20% or more for the past three years, so everyone and his uncle has raised a fund. Total fund-raising doubled from 2004 to 2005, when it exceeded $100 billion, reports Brad Hintz, an analyst at Sanford C. Bernstein. As venture capitalists of the late 1990s can attest, excellent returns attract huge waves of capital, which in turn can kill the returns for those who are late to the party.

Goldman Sachs has the largest private-equity division on Wall Street, having raised an $8.5 billion fund last year. The company reported $354 million of gains and overrides from corporate and real- estate-principal transactions in the second quarter alone. The problem with these returns, as well as those from proprietary trading, is that they’re usually nonrecurring. So a firm must run faster each quarter to top its previous returns.

Investment banks don’t typically divulge their proprietary trading gains or losses, though most acknowledge the profits have been substantial. The success has also persuaded the firms to take on more risk with their own capital. At Goldman the average daily value-at-risk, or VaR, was $112 million last quarter, almost twice the $60 million reported a year before. VaR estimates the potential loss in value of a firm’s trading positions on a bad day.

“Everyone is extrapolating the strength of proprietary desks into the future, and I think that’s a mistake,” says Doug Kass, head of hedge fund Seabreeze Partners.

Uncertainty is evident in the wide spread of analyst opinion about Goldman’s earnings per share next year: $14.48 to $21.05. It’s also why multiples in the sector, which range between nine and 11 times ‘07 estimates, might not be as low as they first appear. If, say, 30% of earnings disappear overnight, multiples jump pretty fast.

A Goldman spokesman counters that history is on the firm’s side. “Over the course of a business cycle, our geographic, business and product diversity can be expected to deliver earnings growth, as they have in 18 out of the past 21 years,” he says.

A housing slowdown may also hurt brokerages that have built up massive businesses around residential mortgages. Last year $460 billion of home-equity asset-backed securities were sold, up from $74 billion in 2000, and $991 billion of mortgage-backed securities were issued, up from $185 billion five years prior, according to Thomson Financial.

Lehman dominates this market. In 2003 it acquired Aurora Loan Services, a residential loan originator, and it has since made additional acquisitions. Now it can originate loans, service them, securitize and sell the bonds backed by the mortgages and then trade the securities.

In the first half of 2006 Lehman originated about $31 billion of residential mortgage loans. It also purchased loans in the open market and pooled them to securitize $67 billion of residential mortgages in the first six months of the year. But not everything is securitized every night. At the end of the second quarter, Lehman had $4.2 billion of loan inventory on its books.

The firm also held about $800 million of non-investment-grade interests in securitizations at the end of the quarter. Underwriters often retain the most junior, risky pieces of a securitization if investors won’t. The value of these volatile residual securities typically are hit first if more mortgage holders than expected default or prepay their mortgages. It’s unclear how much of Lehman’s inventory is hedged for interest-rate or credit risk, and the firm declined to comment. In any event, Lehman seems to have a vested interest in the continuation of the housing boom.

While Lehman and Bear Stearns have the most active mortgage operations, juicy profits have lured others into the game. Most recently Morgan Stanley purchased Saxon Capital, which originates and services subprime residential mortgages, for $706 million.

If the residential mortgage market declines — as the 25% year-over-year drop in mortgage applications suggests — brokers might soon find they have lots of folks looking for something to do. The firms hope their origination arms will gain market share to keep the flow of mortgage loans going. They’re also eyeing the reset of adjustable-rate mortgages in the next few years and the global expansion of the mortgage business as new sources of business.

The prime-brokerage business also runs the risk of disappointing investors. Morgan, Goldman and Bear Stearns control almost two-thirds of this business, estimates Hintz of Bernstein. The shops cater to hedge funds and lend out stock to cover short positions, provide cash-management services, lend on margin, clear trades and provide reporting and custody services.

Hedge-fund clients tend to execute about 20% of their trades on their prime broker’s equity desk. Hintz estimates the hyperactive funds now generate 30% to 35% of the U.S. securities industry’s equity commissions. Their high portfolio turnover and interest in exotic — read: higher-margin — securities makes them hugely attractive Wall Street clients.

Here, too, competition has arrived and profits will be tougher to come by. Merrill, Lehman, UBS and Deutsche Bank are among those who have jumped in. Hedge funds increasingly split their prime business among two or three players instead of staying with just one shop.

And the business may be getting riskier as new entrants offer easier borrowing terms, says Hintz. Firms are more inclined today to lend the same amount against a security or a portfolio for 30 or 60 days, whereas in the past the loan varied daily with changes in the security’s price. Such a change exposes the broker to more risk should the value of the security drop sharply. Newer entrants are also extending loans against entire portfolios instead of against specific securities.

“They’re becoming liquidity guarantors to the hedge funds,” says Hintz, who has Market Perform ratings on Goldman, Morgan, Bear and Lehman, and Outperform ratings on Merrill and JPMorgan Chase.

Morgan Stanley’s prime brokerage unit, says a spokesman, expects “demand for these types of services will increase, not decrease, as modern asset managers trade in an increasing number of different asset classes and markets.”

Hintz estimates that Morgan and Goldman’s prime-brokerage pretax net income will rise about 12% annually over the next few years, down from the 20% gains enjoyed in past years. Bear Stearns, which has the most exposure to domestic business, is the most vulnerable of the three and may find it can increase the group’s bottom line by only 3% in that time.

Growth like that might not satisfy investors who’ve come to expect much more from their brokers.

I plan on taking a short position on the brokers this week. My favorite short candidates are Lehman Brothers (NYSE:LEH) and Bear Stearns (NYSE:BSC).
lehman_brothers

bear_stearns

The Coming Bear: Higher Rates (Part 1)

This is the first in a series of posts, titled ‘The Coming Bear’, that will analyse where the economy is headed. The final post in this series will look at some investment ideas that should do well if the future plays out the way I see it.

Here is a list of the posts in this series:

Part 1: Higher Rates
Part 2: Real Estate Bust
Part 3: Severe Recession
Part 4: Stock Market Crash

The first step I usually take when forecasting the level of an indicator or the price of something is to look at a long term chart and try to explain the movements. So lets look at the chart of the 10-year Treasury bond yield which has historically been considered the benchmark for long-term interest rates.

ten_year_bond

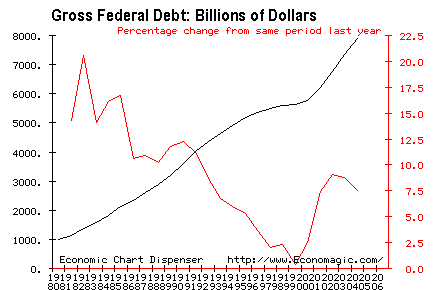
The 10-year has been in a downtrend for the past 25 years declining from over 15% in 1981 to its present level of 5%. What could be factors that affect the rates of the long-bond? While the Fed controls short-term rates, long-term rates are set by demand from investors and supply from the government. Government supply has been steadily increasing during this period due to a growing federal debt that needs to be financed. Since 2000, the rate of growth in the debt has increased due to tax cuts, the war in Iraq, defense against terrorism, and higher government spending on social programs. Debt currently amounts to $8.5 trillion.

federal_debt

Investor demand for bonds is affected mostly by expectations of price inflation and foreign appetite for US securities. Inflation expectations have been declining as people have watched the Consumer Price Index (CPI) fall.

cpi

I am no fan of the CPI since it is constructed to understate inflation, but most people still believe the numbers and form expectations based on it. With inflation seemingly well below the levels of the early ’80s, demand for bonds from investors should be much greater today.

The other source of demand for bonds arises from foreign purchases. As the following chart illustrates, this demand has exploded in recent years.

federal_debt_foreigners

Approximately $5 trillion of the $8.5 trillion in current federal debt is owned by private investors — the rest owned by federal government trust funds and the Federal Reserve. What the above chart means is that foreigners now hold about 50% of the privately owned government debt. In fact, since 2001 foreigners have accounted for the entire increase in privately owned debt and then some.This means that foreigners have been the main players for soaking up additional bond issuance and causing rates to decrease. In particular, China and Japan hold about $1 trillion or 20% the outstanding federal debt. Their intention was to boost exports by keeping their currencies undervalued to the US dollar and using the dollars received through trade to invest in US Treasuries rather than convert it back into their own currencies.

Future Direction of Rates

Now that we have looked at the supply-demand factors that led to decreasing rates over the past two decades, let us analyse what the future holds. The war in Iraq and the threat of terrorism are unlikely to end anytime soon so defense spending is likely to remain elevated. Past tax cuts are unlikely to be reversed and social spending — given the economy’s current weak footing — will continue to increase. Therefore, it is safe to assume that the federal debt will grow at 5% or more over the next 2-3 years.

On the demand side, China and Japan — who have been the biggest buyers recently — will likely decrease the rate of treasury accumulation going forward. Japan has already reduced its US dollar holdings over the past year as it seeks to rebalance its foreign exchange reserves and align the currency mix with that of its trade settlement account, taking into account the increasing importance of the euro. China, too, will do the same for risk management purposes.

Furthermore, Japan — fearing that its growing economy could bring on inflation — has begun raising interest rates which will reduce the amount of funds devoted to the carry-trade. The carry-trade takes place when overseas investors borrow funds in Japan at minuscule rates and buy higher-yielding assets overseas, particularly US Treasuries. No one knows how big of a trade this is, but as it unwinds it will have some negative effect on Treasury demand.

Chinese demand for Treasuries should also fall since they will eventually be forced to take further steps to revalue their currency to appease growing anti-Chinese sentiment in Congress and to slow down their red-hot economy which is growing at over 11%. This will allow China to slow down its rate of Treasury purchases and sell more dollars. And Japan will follow suit since the yen tracks the renminbi for trade-competitiveness reasons. Since China and Japan have been major buyers of Treasuries over the past few years, all that is needed is a small decrease in their rate of buying for yields to shoot up.

How much of an effect will this have on Treasuries? Brad Setser and Nouriel Roubini of Roubini Global Economics estimate that Treasury yields would have risen an additional two percent if it was not for central bank buying.

Now let us look at how future inflation expectations will affect Treasury demand. Price inflation is currently on the uptick growing at 4.8% annually compared to 3.4% for 2005, according to the CPI. But as I said before the CPI has a bias to understate actual inflation which is much higher — just look at the prices increases over the past 12 months of gold, oil and copper which are up 30%, 10% and 49% respectively. M3, a better indicator of inflation, rose at an 8% annual rate in February before data collection was discontinued.

Inflation expectations should increase once foreigners reduce their Treasury purchases and the US dollar depreciates. This will cause the price of commodities and imported goods to increase. Also, as foreigners sell more of their dollars, that money will enter the US economy to be spent rather than be held in the form of Treasuries — this is inflationary.

However, price inflation should be dampened by the recent rise in interest rates — from under 4% in 2003 to 5% now — and its effect on decreasing consumer spending in highly indebted economy. Overall, I expect inflation to stay elevated above the Fed’s “comfort zone” during 2007 and 2008. I don’t think we will see major inflation like the ’70s, but it will be high enough to keep bond investors on the edge of their seats.

My outlook on interest rates is that the supply of Treasuries will continue to increase at the same rate, foreign demand will begin to wane, and inflation will stay around current levels. Therefore, I expect Treasury rates to head higher. For example, I would not be surprised to see the 10-year yield over 6% some time during the next two years. However, over the short-term, rates could fall as it becomes clear that the economy will enter a recession and bond investors believe that inflation will drop.

The Fed Can’t Save the Economy

An excerpt of a column from today’s WSJ, Not Too Fast, Not Too Slow caught my attention:

“But last week, at least, investors looked past that kind of worry. Widely followed Wall Street economists were telling clients that even a significant economic weakening might actually be good for stocks.

“If we could have a hard landing but not a recession, I think that would be a favorable outcome for the financial markets,” says economist Ed Hyman of New York research and brokerage house International Strategy & Investment. Should the Fed start to worry that it has slowed the economy too much, Mr. Hyman says, then it would have to cut rates sharply. Investors would welcome the rate decline as a boost to growth, consumer spending, the housing market and profits.

What Mr. Hyman and many economists fail to realize is that if we get a hard landing we are also going to see corporate profits take a hit. And as far as I know, profits are much more important to share prices than the Fed funds rate. Besides, the last time the Fed cut rates the stock market continued to fall.

Mr. Hyman also states, “History tells me that a significant weakening in the economy and a crisis-induced reversal of Fed policy could make this stock market move up dramatically.” But the same column looks back at history and sees something else:

“Trouble is, although they get talked about a lot, soft landings rarely happen. Going just far enough but not too far — and doing so during an election year and amid conflicting economic signals — is one of the hardest things for monetary-policy makers to do. They almost never have succeeded.

Since the mid-1970s, almost every time the Fed has pushed rates higher, it has created a recession, a bear market or both. The notable exception came in 1994 and 1995, when the Fed raised rates without causing either, but did blow up the bond market and tank the Mexican peso. It looked as if the Fed might achieve another soft landing in the late 1990s, but then came the tech wreck and a deep bear market.”

As the economy continues to slow, I actually expect the market to rally higher in the short-term based on this misguided thinking that the Fed can save the economy by lowering rates. But any rally will be short-lived and would make an excellent shorting opportunity.

Stocks are Still in a Bear Market

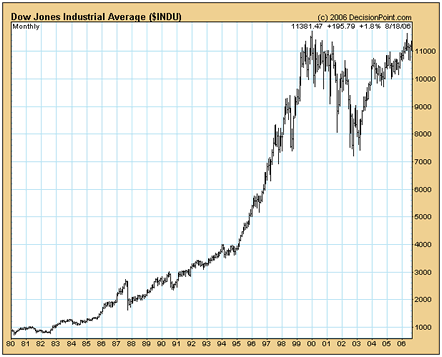
A look at the chart of the Dow Jones Industrial Average seems to indicate that the stock market has recovered from its lows in 2002 and is close to making a new historical high. One might believe that the bull market that began in 1982 has never even ended.

dow

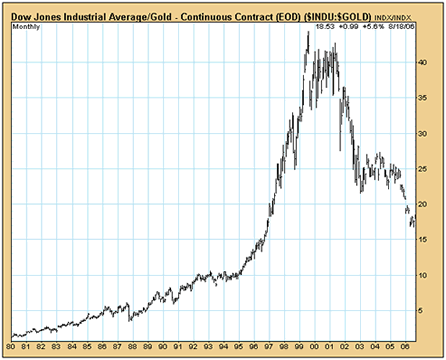
But there is a problem with this analysis. The value of the Dow is measured in US dollars which has been steadily losing value over the last few years. A more stable unit that we could use for measurement is gold which is money that cannot be inflated easily. So if we divide the dollar value of the Dow by the dollar value of an ounce of gold we determine the number of ounces of gold required to buy the Dow.

dow_gold_ratio

A look at this chart reveals that the Dow is off over 60% from it’s high in 1999 and back down to where it was in 1997. The Dow is still very much in a bear market!