Comparing the Current Gold Cycle With That of the ’70s

The following graph plots the gold price during the 1970s over the gold price action since 2001.

gold price during 1970s and now
Source: Plexus Asset Management (adapted from www.ZealLLC.com)

At this point, the current cycle remarkably resembles the price movements of the previous cycle. The gold price could stagnant at the current level for the next year or two and still remain on course for the spectacular gains precious metals enjoyed during the 70s.

This possibility is consistent with my bearish intermediate-term, but bullish long-term outlook on gold. Gold bulls need to keep in mind that no bull market goes up in a straight line and corrections can be severe and plentiful.

Still Nervous of Gold

This year I have been a net seller of gold stocks for fear that gold has entered a mini bear market within a secular bull market. The US is clearly slowing down and the trade deficit, which was the main culprit for the surge in global liquidity, has recently started to improve. If liquidity growth slows down then all assets which had benefited from it previously will begin to suffer.

The only gold stocks I have remaining in my portfolio are those which I would be happy to see decline in price so that I can buy more and reduce my average cost. I am also shorting some stocks for hedging purposes.

If a liquidity crunch does arise, you can be sure that at some point the Fed will begin cutting interest rates. This will cause inflation to accelerate, the US dollar to drop, and the gold price to enjoy its next leg up to $1000 per ounce.

No Near-Term Relief for Housing

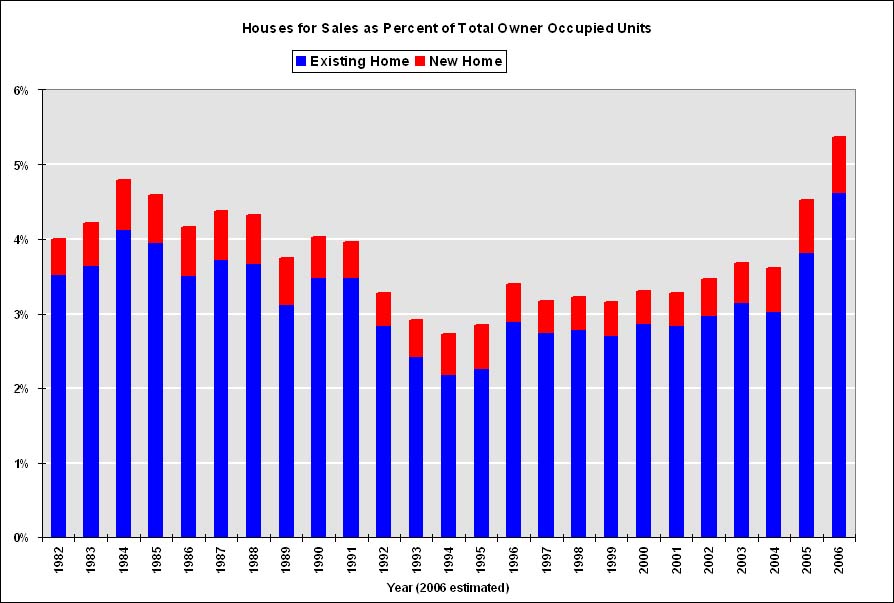
Last January, I wrote about how calls for a housing recovery this year were premature. As the following graphic illustrates, housing has resumed its downward spiral which is in early innings compared to the last bear market in housing.

home_prices

My primary concern at the moment is that a huge number of mortgages are due to reset at a time when interest rates are rising.

arm_reset_scedule
Source: Lamont Trading Advisors, Inc.

And I don’t think we have heard the last about those troubled subprime mortgages. As a result, I am initiating a short position in Countrywide Financial (NYSE:CFC).

Jobs Data: Monthly vs. Quarterly Surveys

The Bureau of Labor Statistics’ monthly survey of employers is a popular report that investors use to gauge the strength of the labor market. However, the numbers can be way off from reality.

For instance, the bureau releases a quarterly report, titled “Business Employment Dynamics” that comes from state unemployment records. The latest report was released for the 3rd quarter of last year and showed that only a net 19,000 private sector jobs were added to the economy.

On the other hand, the widely reported monthly survey concluded that private-sector employment grew by 498,000 jobs — a healthy number considering the economy grew by only 2% during that period.

A big difference was in construction employment where the monthly survey determined that 34,000 net-jobs were added compared to a loss of 77,000 jobs in the quarterly study.

What’s causing the significant discrepancy? One reason may be that the bureau uses a “birth/death” model to estimate the change in employment from the launching and demise of businesses. Eventually, the monthly numbers will be revised to reflect the results of the quarterly survey, but that won’t be done until data is available for the 4th of last year and the 1st quarter of this one.

I tend to ignore the monthly jobs data because it is often subject to large revisions much later on, at which point the numbers are useless as a forecasting tool since employment is a coincident indicator of economic growth.

Copper Still Looks Vulnerable

At the end of last year I expressed my nervousness about the copper markets and how the price at that time of $3/lb. was incredibly expensive. Since then copper fell to a low of $2.40 before rebounding to $3.75. Currently, it’s selling for $3.34 and I am more bearish on copper now than I was before.

copper_price

My negative outlook on copper is based on a slowdown in the US economy and the likelihood it will drag the other economies of the world down along with it, which should reduce demand for base metals.

I believe that copper along with other commodities are 5 years into a secular bull market that typically lasts for 10 to 20 years. However, no asset price rises in a straight line and copper along with other base metals will eventually enter a cyclical bear market (or may have already entered one given copper prices are down 10% since May 2006) within a secular bull market.

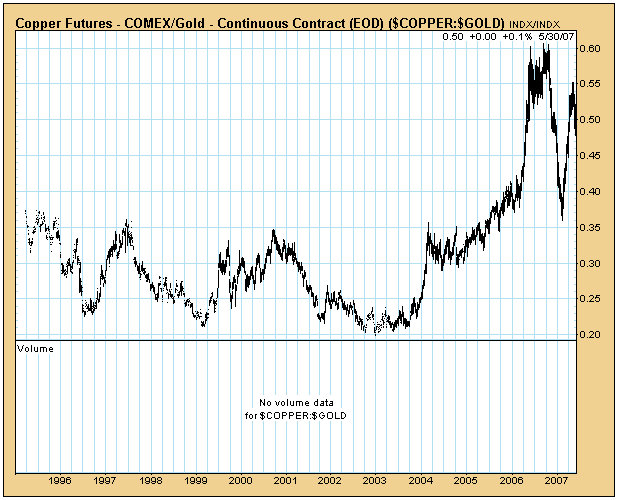
A chart I like to look at to put the current real value of copper into historical perspective is the copper-gold ratio.

copper_gold_ratio

It can be misleading to determine copper’s real value by looking at its US dollar price. The US dollar and all fiat currencies decline in value over time, which makes everything priced in them more expensive. If instead we price copper in terms of gold we can get a better understanding of copper’s value since gold’s real value is stable over time.

I could only find a chart dating back to 1995, but looking at data since 1980, the ratio reached its highest value of 0.6 last year. Currently, the ratio is not far off at 0.5. This is well above its historical average of 0.3.

It is warranted that copper should be trading above it’s historical average given that the world is experiencing a period of synchronized growth like never before. However, if the global economy slows down the copper-gold ratio might decline to around 0.3. At current gold prices, that means copper could fall to $2. If gold declines to $550, then copper could collapse to $1.65.

Copper isn’t the only metal that looks risky. Aluminum, nickel, and zinc prices are all dependent on a strong global economy. If you are also worried about a looming US slowdown, now may be a good time to sell your base metal stocks.

By the start of this year, I had liquidated all of the stocks in my portfolio which had exposure to base metals. In fact, a collapse in base metals prices has me worried that it could temporarily affect the gold price; therefore, I have been selling some of my gold stocks, too.

China’s Rate Increases are Futile

Yesterday, Chinese stocks ignored a rate increase and rose to a record high. It marked the fourth time in a row that Chinese share prices rose on the first day after an interest rate increase. The Chinese authorities are attempting to cool down what is clearly an overheated economy and stock market.

After the 0.27 percentage point increase, a one-year deposit will earn 3.06%, but that interest is taxable, making bank deposits a losing bet in an economy where inflation is reported to be running at 3%. On the other hand, the Shanghai Composite Index has quadrupled in the past two years.

The one-year lending rate was increased by 0.18% to 6.57%, so that the real cost of borrowing is around 3.5%. With the economy expanding at 10% during the last few years there is little wonder why investment activity is so high in China.

China’s fixed exchange rate prevents the government from meaningfully increasing interest rates. Although there are other measures that can be introduced to temper investor enthusiasm such as a capital gains tax, most investors believe that the Chinese government is wary of sparking a crash before the Olympics next year.

Even if the Chinese government does not act to contain the current bubble, a crash could still be triggered by some outside source such as a geopolitical shock. Although I am certain that Chinese stocks are way overvalued, I realize that they can easily become even more overvalued and remain so for a long time. However, the odds of a significant correction or crash are increasing by the day.

The Shenzen Composite and Nasdaq

I just noticed an Economist article published a couple of weeks back that underscores the current craze in Chinese equities.

As the following chart by Michael Panzer illustrates, the Shenzhen Composite is starting to look eerily similar to the bubble stages of the Nasdaq Composite during 1999 and 2000.

chinanasdaq

Will the Shenzhen Composite suffer the same fate as the Nasdaq’s during 2000 and 2001? I think it’s a certainty though I’m not sure when.

Uranium Frenzy

historical_uranium_price

There is an interesting article in the NYTimes that discusses the recent excitement over uranium:

Not many. Prices for processed uranium ore, also called U308, or yellowcake, are rising rapidly. Yellowcake is trading at $90 a pound, nearing the all-time high, adjusted for inflation, of about $120 in the mid-1970s. The price has more than doubled in the last six months alone. As recently as late 2002, it was below $10.

A string of natural disasters, notably flooding of large mines in Canada and Australia, has triggered the most recent spike. Hedge funds and other institutional investors, who began buying up uranium in late 2004 to exploit the volatility in this relatively small market, have accelerated the price rally.

But the more fundamental causes of the uninterrupted ascendance of prices since 2003 can be traced to inventory constraints among power companies and a drying up of the excess supply of uranium from old Soviet-era nuclear weapons that was converted to use in power plants, coupled with the expected surge in demand from China, India, Russia and a few other countries for new nuclear power plants to fuel their growing economies.

Strathmore, with a market capitalization of $300 million, is one of about 400 publicly traded “uranium stock” companies (most of them, like Strathmore, trade on the Toronto Stock Exchange). Many of the firms are much smaller. Some are essentially shell games.“There’s so much money pouring into this sector,” said Julie Ickes, editor and publisher of StockInterview.com, which tracks uranium prices and companies. “If you put ‘uranium’ in your company name, you can look like you’re looking for property,” he said. “It’s a lot of talk.”

Globally, 180 million pounds of processed uranium is consumed each year by nuclear power plants. Production worldwide from mines amounts to only 100 million pounds. Roughly 75 million pounds come out of utility company stockpiles. What is actually traded in the spot market is only about 35 million pounds.

Some industry watchers fear the uranium market is entering the bust phase of another boom-bust cycle.

“It’s like the tech bubble,” said James Finch, senior editor of StockInterview.com. “We’re waiting for the crash.”

But others see plenty of room for prices to climb further. One is Bob Mitchell, founder of Adit Capital, a small hedge fund in Portland, Ore. In December of 2004, he became one of the first hedge fund managers to start buying uranium.

Since then other hedge funds and institutional investors have jumped into the market, some of them hoarding uranium while the price keeps rising. Even some established mining production companies are spinning off or partnering with hedge funds.

Uranium executives, investors and analysts alike agree that a major underlying cause of the current bull market is that mines are not generating enough uranium to meet growing demand. The supply constraints can be traced back to the end of the cold war when the United States and the former Soviet Union started converting enriched uranium from dismantled atomic weapons into nuclear fuel for peaceful purposes.

That program, and huge incentives offered to uranium companies by the Nuclear Regulatory Commission, flooded the market with excess supply. At the same time, demand shrunk. The price of uranium fell sharply.

As a result, most uranium producers scaled back or closed their mines. Some companies sold themselves to French, Canadian and British corporations, which now dominate the industry. Meanwhile, some nuclear power companies sold off some of their inventories when the price was low to avoid storage costs.

But by 2003 uranium inventories held by utilities in the United States were coming back into balance. Then a series of natural disasters — flooding of the world’s largest uranium mine, McArthur River in Canada, and more recently at other mines in Canada and Australia — further pinched supply. Power companies now find themselves competing with aggressive institutional investors for high-priced uranium.

Meanwhile, the people staking claims and drilling underground are happy to see the frothy market get frothier. So far this year, 2,700 new uranium claims have been filed with the Bureau of Land Management in Colorado alone. That is nearly half of the claims filed in all of last year, and a big jump from the 104 claims for 2004.

The WSJ, too, has recently chimed in on the subject:

Financial investors aren’t licensed to possess the radioactive mineral, which is subject to tight government controls aimed at keeping it out of the hands of terrorists and rogue states. Instead, several of those investors have secured access to ownership rights of material stored at licensed repositories in North America and Europe, exploiting legal channels previously used only by utilities and suppliers.

But even with only paper rights to the material, hedge funds are exacerbating what was already the biggest nuclear-fuel supply crunch in decades, according to utilities, miners and large traders. The market represents the latest corner in which hedge funds — private partnerships that cater to wealthy investors and large institutions — are seeking outsize returns, an increasingly challenging task as the number of funds multiplies.

Many funds say they are holding their uranium off the market because they expect the price to climb.

The market began taking off about two years ago. In May 2005, several months after Adit entered the market, Uranium Participation Corp. raised about $80 million for a uranium investment fund via an initial public offering on the Toronto Stock Exchange, and has raised roughly twice as much since. Managed by executives of the Canadian mining concern Denison Mines Corp., UPC controls more than 6.8 million pounds of uranium yellowcake or gas. It says its average yellowcake acquisition cost was $31.75 a pound.

A similar fund, Nufcor Uranium Ltd., went public last July on the London Stock Exchange’s AIM small-stock market and now controls 2.3 million pounds, the company says. Regulatory filings show that hedge funds invested in that IPO, including GLG Partners, Citadel Investment Group and QVT Financial LP.

Shares of both funds are trading at about 20% more than the current market price of their uranium, suggesting that investors see prices continuing to climb.

Ux says financial funds have purchased about 20 million pounds of yellowcake since entering the market in late 2004. That is roughly a fifth of the supply being mined each year. Such funds bought about 25% of the uranium sold on the spot market in 2005 and 2006. They are husbanding most of their supplies, having sold only two million pounds so far, Ux officials say.

When I first started to invest, uranium was selling for only $15/pound and it was the commodity that I was most bullish on. However, with its recent parabolic rise I have liquidated pretty much all of my uranium investments.

Some of the stocks I held were Strathmore Minerals (TSXV:STM), Energy Metals (TSX:EMC), Western Prospector (TSXV:WNP) and Strateco Resources (TSXV:RSC). I was able to make 37%, 40%, 31% and 421%, respectively on my investments in these names. For full disclosure, the only uranium stock I still own is Altius Minerals (TSX:ALS), however uranium is one of many commodities this company is involved with.

There are three reasons why I turned bearish on uranium. First, as the above articles state, speculators have purchased approximately 20 million pounds of yellowcake in the past 2 years. When this is compared to the 35 million pounds that are traded on the spot market each year, there is little doubt that investors are the main driver for the uranium price right now. If for whatever reason investors turn bearish, the uranium price could plummet just as quickly as it has spiked. Just look at how badly uranium performed in the late ’70s.

Second, the number of uranium exploration companies has increased by 40-fold in the last few years. That means that at some point, the supply of uranium is going to increase substantially.

And third, a higher uranium price will curtail demand from utilities. The mistake that many uranium investors are making is that they assume that demand from uranium users is inelastic since the cost of buying uranium is small compared to the costs of keeping a nuclear power plant running. However, this is not necessarily the case.

Utilities could reduce the amount of uranium that is used in their reactors by increasing the enrichment process. Enriching uranium has a cost, too, but for a given cost of uranium and enrichment, there is an optimal amount that minimizes costs. So when the price of uranium increases to over $90/lb. as it recently has, the utility will use less uranium and more enrichment to fuel its reactors. According to some calculations I have seen, this could significantly reduce the demand for uranium.

I am not predicting that the uranium price is about to crash. After all, uranium is such a small market that only a single billion dollar hedge fund is necessary to push its price up significantly. Also, supplies are currently tight and despite the increased exploration activity, it takes several years for uranium to be found, mined and delivered to the market.

However, when supply does eventually catch up with demand, prices will plummet and investors will get hurt badly. I don’t know when that will be, but I feel more comfortable watching from the sidelines.

Ethanol Demand Driving Up Food Prices

Earlier this year President Bush called for America to cut its petroleum consumption by 20% over the next decade, largely by using more ethanol which creates less pollution and can be produced using home-grown corn. Already there are numerous subsidies for biofuel producers which have allowed them to significantly increase ethanol production.

In the past 12 months, this has caused the price of ethanol to rise from just over $1/gallon to $1.75/gallon and corn prices to double from $2/bushel to nearly $4/bushel. Currently, corn supplies are at their lowest levels in 34 years.

The most recent CPI report seems to indicate that beef and poultry prices are being affected by higher corn prices. Most of the corn grown in Iowa is used to feed farm animals and make corn syrup for processed foods. The rising price of corn is also resulting in farmers, nationwide, planting more of it and less wheat and other crops. Therefore, rising corn prices could lead to general food price inflation.

The US could reduce these cost pressures by importing more ethanol from Brazil, where sugarcane is used as feedstock. Brazil can produce ethanol for 22 cents a liter compared to 30 cents a liter for corn-based ethanol. However, the US government is unlikely to reduce the high tariffs currently imposed on imported ethanol in deference to America’s powerful farming lobby.

This means that the Bush administration’s emphasis on ethanol as a fuel source is going to put upward pressure on food prices for the foreseeable future. I’m not sure how significant this pressure is going to be, but it’s worth keeping an eye on food prices.

Can the Fed Save Housing?

Yesterday the market got a lift from the FOMC statement which was interpreted to indicate that the Fed no longer held a tightening bias, setting the stage for a possible rate cut later this year. The expectation is that Fed easing will help the troubled housing sector by making it easier for people who are struggling to meet their mortgage payments to refinance at lower interest rates.

I can’t see how lower interest rates can save the housing market. First, the rise in defaults on subprime mortgages have prompted all the major lenders to tighten lending standards. As this graph shows, the last time lending standards were substantially tightened was in 1990 and 1991, which were terrible years for housing. Despite lower costs for mortgages, tighter lending standards may make getting a mortgage approved more difficult.

Second, inventories are at record levels and may continue to rise due to a large number of homes currently in the foreclosures process. In order for housing activity to recover, the large supply of homes on the market needs to be reduced. Even if lower interest rates were to increase demand, it could take a while for this inventory to be worked down.

And third, stagnant prices over the last year may have shaken investor confidence. Speculators, who were a significant source of demand for homes during the last few years, are not likely to be persuaded by Fed rate cuts to jump back in. More likely, they will wait until there is clear evidence that home prices have recovered before jumping back in with both feet.

The Fed was unable to save the internet/telecom sector in 2001. However, that monetary easing did spark a boom in the housing sector. It is possible that Fed easing will again help fuel a bubble in another sector of the economy. But housing can’t be revived so quickly.