Category Archives: Real Estate

The Subprime Market Implosion and its Consequences

The subprime mortgage market has been dominating news lately with signs that rising defaults and delinquencies are wreaking havoc on the mortgage industry. Here are some of the headlines:

  • Accredited Home Lenders Holding Co. reported a $37.8 million loss for the 4th quarter — three times wider than analysts expected.
  • ResMae Mortgage Corp. became at least the 20th subprime lender to close or be sold when it filed for bankruptcy.
  • Freemont General Corp., a major lender to people with weak credit histories, announced that it has stopped providing “piggyback” mortgages.
  • HSBC added $1.76 billion to its bad-loan costs for 2006 to cover ailing mortgages.

At the start of this year a general consensus has formed that housing is bottoming. This was based on 4th quarter statistics that suggested inventory, sales and starts were stabilizing. On Friday, Alan Greenspan gave an upbeat assessment on housing during a speech here in Toronto and made the following comments:

The worst of the adjustment is over, meaning not that the market is turning, but that the rate of decline was at its maximum in the third quarter and continued over in the fourth quarter and should now be moving to a much less negative direction.

Regarding sub-prime mortgages:

We do have a problem here, it’s probably not over. It may actually infect some parts of the prime mortgage market, but there’s no real evidence that this is a significant issue.

I have a different opinion than the ‘Maestro’. I believe that the subprime market implosion will lead to another leg down for housing activity. To see why, consider that a decade ago subprime mortgages totaled a mere 2% of the entire mortgage market. Today they are one-sixth of all mortgages.

subprime_mortgages

The percentage of subprime delinquencies are at the highest level since 2002. Keep in mind that the subprime mortgage market is now four times bigger than it was then. And the delinquency rate is likely to head much higher.

About 80% of subprime mortgages today are adjustable-rate mortgages that have been nicknamed “exploding ARMs” because they have low fixed-interest payments in their first few years but then usually adjust to higher interest payments. It is estimated that around $1 trillion in adjustable-rate mortgages are due to reset over the next 2 years at much higher interest rates.

A study by the Center for Responsible Lending predicts that 20% of subprime mortgages made over the last 2 years, equivalent to 5% of total mortgages originated could go into foreclosure. This new supply of foreclosed homes dumped on the market would easily push down prices and curtail home building.

Moreover, there is increasing pressure on Capitol Hill to enact legislation sponsored by Barney Frank, the new chairman of the House of Financial Services Committee, designed to tighten up lending standards and disclosure rules. This could shut out 25% of potential subprime buyers from obtaining mortgages according to Merrill Lynch.

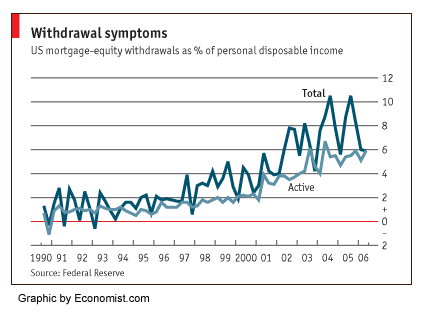
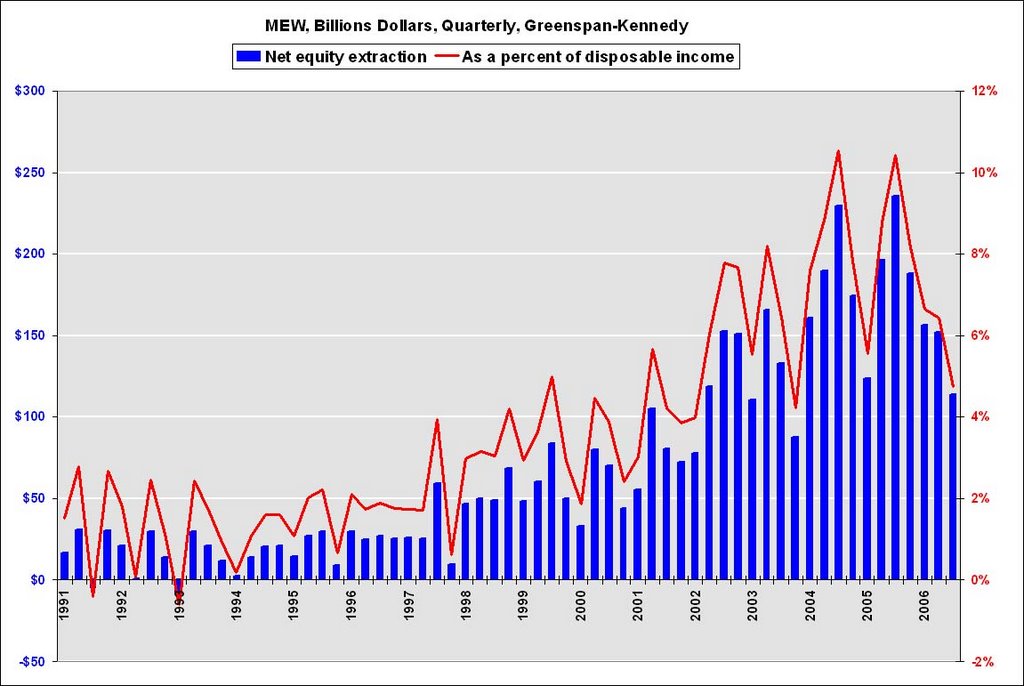
It is hard to imagine mortgage equity withdrawals (MEWs) continuing at the same pace as in recent years. Given that MEWs were a major source of household liquidity (as this graph by Calculated Risk depicts), consumer spending will have a tough time increasing.

Increasing foreclosures along with tighter lending standards for new borrowers is going to cause this housing downturn to be one of the worst ever, and likely to drag the economy into a recession.
Housing Recovery Still Far Off

Heading into the new year, the consensus seems to be that housing is bottoming. The people who hold this view point to the November housing data:

  • Existing home sales rose in November following October’s increase. Down 10.7% year-over-year.
  • Total housing inventory fell by 1%. Up 30% yoy.
  • New Home Sales rose by 3.4%. Down 15.3% yoy.
  • Housing starts increased 6.7%. Down 25.5% yoy.

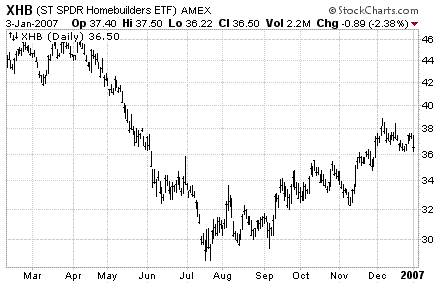
And as expected the stocks of home builders have been rallying:

xhb_price_chart

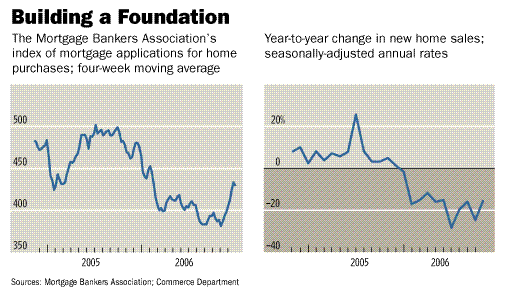
What could have caused this increase in housing activity? Three things come to my mind: 1) a reduction in prices or greater incentives offered by sellers who are unable to make their mortgage payments and are desperate to sell their homes, 2) falling mortgage rates causing mortgage applications to rise according to the MBA survey, and 3) an increase in real wages.

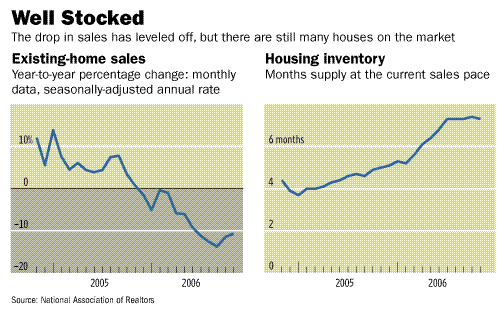
Whatever the reason it’s important to put this data in the proper context. Over the past year home sales still are in a downtrend and inventories are near recent highs. And as any chartist knows, no data or price action will trend upwards or downwards in a straightline — pullbacks are to be expected. Looking at the following graphs by the Wall Street Journal, I find it hard to conclude the housing is out of the woods just yet.

housing_data_2housing_data

I have been a housing bear for a long time and the fundamentals still have not improved. Here are some reasons why I think housing activity will slow even further:

  1. The number of building permits issued, a good forecaster of future housing activity, fell by 3% in November as compared to October.
  2. The rate of home buying cancellations which has exploded is not factored into the home sales and inventory data which will lead to major downward revisions later on.
  3. According to past housing cycles, the peak-to-trough decline in housing starts is 47.3%. In the current cycle housing starts have so far only declined by 24.4% from February 2005’s peak.
  4. Households are spending a record percentage of their incomes on mortgage obligations.
  5. The recent rise in foreclosures will lead to a tightening of lending standards.
  6. Mortgage rates will increase due to foreigners reducing their US debt purchases.

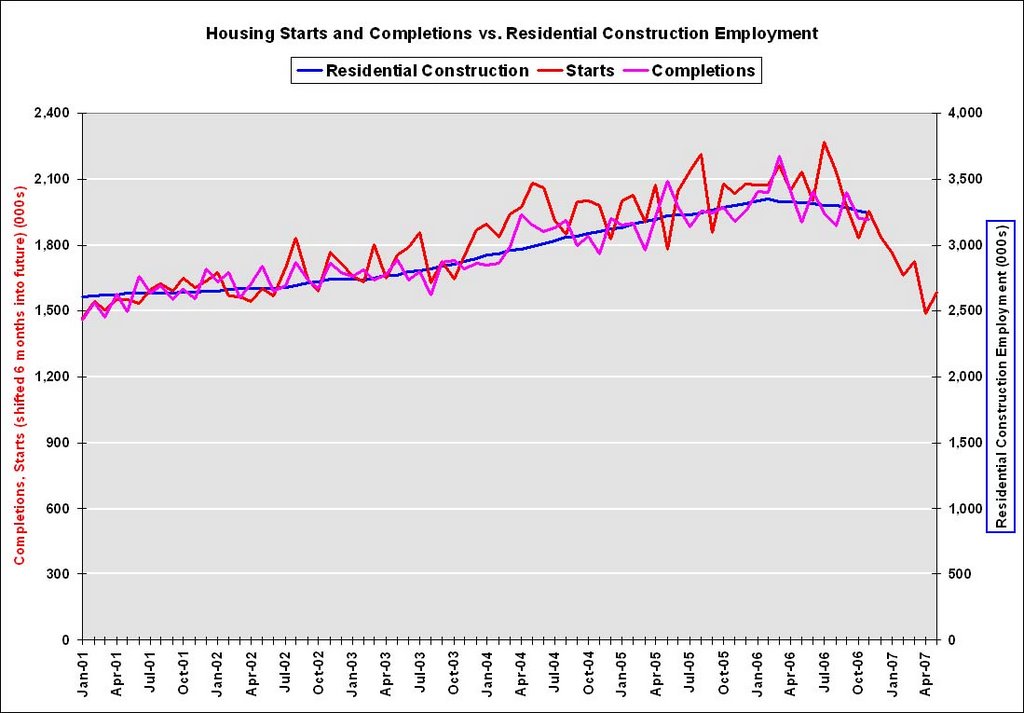
For these reasons I believe housing is going to continue being a drag on the economy in 2007. How much of a drag? To answer this I like to refer to an excellent chart by Calculated Risk. According to Calculated Risk:

This graph shows starts, completions and residential construction employment. (starts are shifted 6 months into the future). Completions and residential construction employment are highly correlated, and Completions lag Starts by about 6 months.

Based on historical correlations, it is reasonable to expect Completions and residential construction employment to follow Starts “off the cliff”. This would indicate the loss of 400K to 600K residential construction employment jobs over the next 6 months.

In addition to the residential construction layoffs, there will be significant job losses among real estate agents and mortgage brokers. Approximately half of all private sector jobs created since the 2001 were tied to housing. The loss of most of these jobs should easily be enough to tip the economy into a recession.
Increasing Subprime Mortgages Delinquencies

The WSJ reports that delinquencies on subprime mortgages have been increasing at a troubling rate recently.

Based on current performance, 2006 is on track to be one of the worst ever for subprime loans, according to UBS AG. “We are a bit surprised by how fast this has unraveled,” says Thomas Zimmerman, head of asset-backed securities research at UBS. Roughly 80,000 subprime borrowers who took out mortgages packaged into securities this year are behind on their payments, the bank says.

subprime_mortgage_delinquencies

The fact that borrowers with bad credit histories are now having a tough time making loan payments shouldn’t come as a complete surprise if we consider how the boom began:

The subprime industry’s current troubles can be traced back to 2003 and 2004, when defaults were unusually low. Investors who purchased these loans did well and were eager to buy more. That encouraged lenders to lower their standards, making loans to more people with low credit ratings. Lenders also grew less inclined to demand full documentation of income and assets and more willing to offer “piggyback” loans that allowed borrowers to finance 90% or 100% of the purchase price without being required to buy private mortgage insurance.

Many lenders kept introductory “teaser” rates low even after short-term interest rates began rising in June 2005, while increasing the amount the rate could rise on the first adjustment. That meant borrowers would face sharply higher costs when their monthly payments were reset.

The environment has changed over the past year with interest payments increasing for borrowers. And if they aren’t able to make their payments, they can’t sell their houses as quickly and for as much value as before.

The borrowers aren’t the only ones feeling the pinch in the subprime mortgage market:

If delinquencies continue to grow, the pain could also be felt by investors who have flooded into the market for subprime securities. Because of the way mortgage-backed securities are structured, investors who buy investment-grade securities aren’t likely to be hurt if losses are close to expectations. But if losses on the underlying mortgages substantially exceed expectations, some investors who buy the riskiest slices of subprime securities are likely to rack up losses. These include hedge funds and investors who buy collateralized debt obligations, pools of debt instruments that are often snapped up by foreign buyers.

There has been a bubble in subprime mortgage securities which was fueled by foreign governments wishing to invest their dollar reserves in debt instruments and by hedge funds who were engaged in the carry-trade. As delinquencies continue to soar it is reasonable to expect foreigners and hedge funds to pull out of the mortgage-backed securities market. This will force lenders to tighten their lending standards and cause a substantial decline in the volume of subprime mortgages. A fall off in mortgage activity will further hurt the housing market and, of course, the economy

How Much Does Housing Wealth Boost Consumption?

No one will debate whether increasing home prices have had a positive effect on consumer spending. But there is considerable debate on how significant this effect is. I am in the camp that believes that the housing boom was the main contributor to consumer spending since 2001.

Last week’s Economist highlights a new study that estimates that each dollar increase in house prices eventually boosts consumer spending by 9 cents rather than 3 to 5 cents as widely thought. This implies that a loss of $1 trillion in housing wealth — which is how much housing wealth increased annually in recent years — would cause consumption to decline by $90 billion or three-quarters of a percentage point from GDP.

hew_income

In addition, as the housing slump worsens we can expect massive unemployment to hit construction workers, real estate agents, mortgage brokers, etc. This will lead to a substantial loss of income and consumption which should cause GDP to fall by much more than three quarters of a percent.

Don’t Let the New Home Sales Data Fool You

The headlines on reports of the new home sales data highlight the fact that sales unexpectedly increased by 4.1%, the largest rise in 5 months.

Now before you get excited that the housing market may be stabilizing let me point out some things that I found from looking directly at the data:

  1. Sales in May, June and July were revised sharply lower.
  2. The median sales price of a new home fell 1.3% year-on-year, the first year-on-year decline since 2003.
  3. The housing data is subject to large statistical errors. The standard error is so high, in fact, that the government cannot be sure sales increased at all in August. The 4.1% increase is statistically meaningless.
  4. It can take up to six months for a trend in sales to emerge. New home sales have averaged 1.082 million per month over the past six months, up slightly from 1.080 million in the six month period ending in July — basically flat.

If new home sales really did increase, I attribute it to builders who are cutting prices and offering massive incentives in order to reduce inventory.

The market and media seem to be focusing on the headline number and pushing stocks higher. But the facts above suggest that the new home sales data does nothing to prove that housing has recovered. To reach such a conclusion we would need look at more data.

The Coming Bear: Severe Recession (Part 3)

I will build on my conclusions from the first two parts of this series to analyze where the economy is headed. In the first part I discussed why interest rates are heading higher. As a consequence, in the second part of this series I argued that the housing market will experience falling prices. If my predictions turn out to be correct, the economy will suffer a recession that would be even more painful than that of 2001.

What Recession?

The 2001 recession was relatively short and mild compared to those in the past. As the economy contracted, President Bush provided stimulus by introducing legislation that cut taxes while simultaneously increasing spending on social programs and defense.

The economy also received a boost when the Federal Reserve rushed to cut rates to an unprecedented level of 1%. At the same time China entered the WTO and U.S.-China trade exploded. Since China wanted to maintain the yuan’s peg to the dollar, they were forced to use their surplus dollars to buy U.S. investments, in particular bonds which caused both short and long-term rates to fall.

Historically low rates spurred consumers to take on record debt which was used to buy things like plasma TV’s, SUV’s, stocks, and especially houses. As the demand for housing outstripped supply, prices started to rise at an unusually high rate. When the value of peoples homes increased it caused their wealth to also increase even though their wages saw no improvement during the same period. This wealth effect contributed to further consumption and home equity extraction.

The Housing Effect

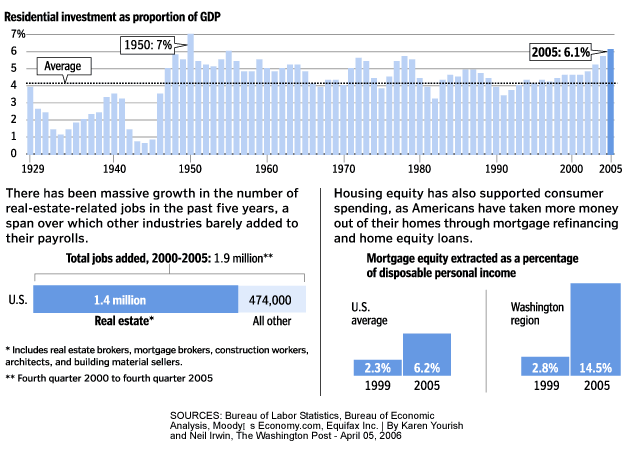
Since 2001, manufacturing has been replaced by housing as the main engine for economic growth. As the following graphic shows, the booming housing market’s impact on the economy cannot be overstated.

housing_impact_economy

However, as I concluded in the previous part of this series housing is overvalued and prices will decline over the coming few years. Such a scenario would devastate the economy. Dean Baker estimates that a contraction in housing activity could shave 3 to 4 percent off GDP.

Housing construction is equal to approximately 5 percent of GDP. Construction of new homes has been going on at a near-record pace over the last few years, in response to the run-up in housing prices. Home construction could easily fall back 40 percent (this was the drop off in the 1981-82 recession), which would imply a direct loss in demand equal to 2 percentage points of GDP.

In addition, the large wealth effect associated with the housing bubble, which has spurred a consumption boom in the last few years, will go into reverse as housing prices plummet. Research from the Federal Reserve Board shows that a dollar in additional housing wealth leads to 4 to 6 cents of annual consumption. This implies that a loss of $5 trillion in housing wealth would lead to a decline in annual consumption of between $200 billion and $300 billion. This loss in consumption is equivalent to 1.6 to 2.5 percentage points of GDP.

Combining the 2 percentage point drop in demand due to a falloff in housing construction with the 1.6 to 2.5 percentage point drop in demand due to the reversal of the housing bubble’s wealth effect leads to a falloff in demand of between 3.6 and 4.5 percentage points of GDP. If employment fell in the same proportion, this would imply the loss of between 5.0 million and 6.3 million jobs.

Since recent data is indicating a hard landing for housing, I am expecting that we will see a recession in 2007. This time Fed rate cuts will not save the economy since foreigners will put upward pressure on long rates. In addition, the government will be handcuffed to provide fiscal stimulus since it is already running unsustainable budget deficits. Therefore, the upcoming recession should be far more painful than the last economic contraction and it could turn out to be as bad as Japan’s recent experience.

Stats Indicate Hard Landing for Housing

Take a look at some recent housing numbers collected by Comstock Partners:

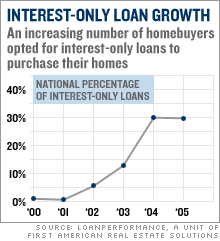
  • 32.6% of new mortgages and home equity loans in 2005 were interest only, up from 0.6% in 2000
  • 43% of first-time home buyers in 2005 put no money down.
  • 15.2% of 2005 home buyers owe at least 10% more than their home is worth.
  • 10% of all home owners have no equity in their homes
  • $2.7 trillion in loans will adjust to higher rates in 2006 and 2007.
  • 70% of borrowers who took out pay-option ARMS in the past year have loan balances larger than their initial loan.
  • Homeowners  face higher payments as mortgages are reset. Generally, monthly payments rise between $200 and $500 depending on the size of the mortgage.
  • According to Reality Trac, August foreclosures were up 23% over July and 53% over a year ago.
  • The number of homes for sale is at record highs, and inventories are 59% higher than a year earlier.
  • New home sales are down 22% and existing home sales down 11%.
  • The NASB housing market index has recorded an all-time decline.
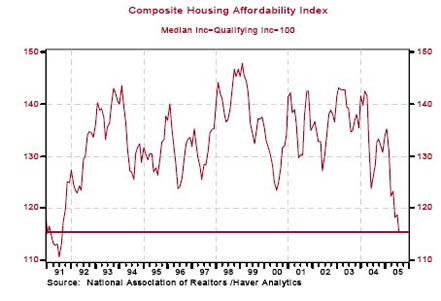
  • The housing affordability index is at a 15-year low.
  • The house price-to-income (rents) ratio is off the charts. According to HSBC, in 18 states accounting for over 40% of national home values, the price-to-income ratio is 3.6 standard deviations above the mean.
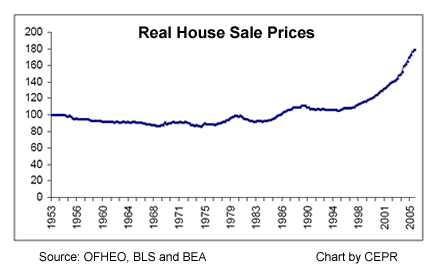
  • The OFHEO index of house prices deflated by the consumption price deflator has soared to a record high of 350 from 250 in 2001. From 1976 to 1996 it never was above 220.
  • According to the NAR the year-to year prices of existing homes are now flat. A short time ago they were rising at a yearly rate of 16%.
  • Nationally, home prices have not declined on a year-to-year basis since 1933. Recently, however, prices have been dropping in the North East, West and Mid-West.
  • Sales incentives are now estimated at 3% to 7% of selling prices.

These are ugly stats and lead me to believe that housing is in for even tougher times ahead.

The Coming Bear: Real Estate Bust (Part 2)

In the first post of this series, The Coming Bear, I looked at interest rates and explained why I think they are heading higher. With that in mind let’s take a look at the housing market which has been the engine of growth for the economy in recent years — I will discuss how important the housing boom was on the economy in Part 3 of this series.

The Creation of the Housing Bubble

Many contend that the housing bubble was inflated due to the Federal Reserve lowering the funds rate from 6.5% in January 2001 to 1% in June 2003 — a level not seen since 1958 which was maintained until June 2004 when rates were hiked. This pressured mortgage rates to fall to levels not seen in fifty years.

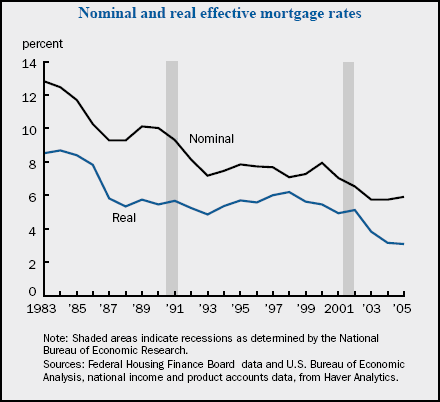
Even during the Fed’s subsequent hiking campaign, mortgage rates continued to decline — most likely due to the Chinese and Japanese purchasing hundreds of billions of dollars worth of bonds which completely offset the Fed’s efforts to cool down the mortgage market. It should also be noted that real mortgage rates have continued to fall recently even though nominal rates have started increasing due to inflation concerns.

mortgage_rates

The fall of the Nadaq by 70% during 2000-01 also helped the housing sector since it caused many tech investors to shift their funds and trading mentality to real estate which they considered to be a risk-free investment. According to Robert Shiller:

Once stocks fell, real estate became the primary outlet for the speculative frenzy that the stock market had unleashed. Where else could plungers apply their newly acquired trading talents? The materialistic display of the big house also has become a salve to bruised egos of disappointed stock investors. These days, the only thing that comes close to real estate as a national obsession is poker.

Another factor that propelled the housing bubble was the deterioration of mortgage lending standards. According to the RealEstateJournal:

Investment banks and other firms have been buying mortgage loans from lenders and packaging them into securities for sale to investors since the 1980s. But investor demand has surged in recent years, largely because in an era of low returns, mortgage-backed securities offer yield-starved investors much higher returns than government bonds.

Investors’ strong demand for mortgage debt, besides allowing lenders to offer many borrowers better terms, has also made it easier to offer mortgages to borrowers who might not easily qualify for a loan. The growth of the mortgage markets spreads the risks around. But some mortgage-industry analysts say lenders have become less stringent in their loan terms because they can sell almost any type of loan to those who package mortgage securities for investors.

“Loose lending standards are probably the single biggest thing fueling the speculative fever we have today” in housing, says Kenneth Rosen, an economist who is chairman of the Fisher Center for Real Estate at the University of California at Berkeley.

The buyers of these mortgage-backed securities include hedge funds — who use the “carry trade” to borrow at low rates — and Asians, specifically the Chinese and the Japanese — who seek to diversify their foreign reserves away from Treasuries.

Proof that increased demand for mortgage-backed securities are leading to a loosening of lending standards can be seen in the growth of “exotic” mortgages such as interest-only loans.

interest_only_loan_growth

Why the Housing Bubble is Unsustainable?

It is unlikely that Americans can continue buying houses at the same pace. First, house prices have risen too much for most people to afford. The NAR’s latest housing affordability index level of 102.8 is at a 15-year low.

HousingAffordability

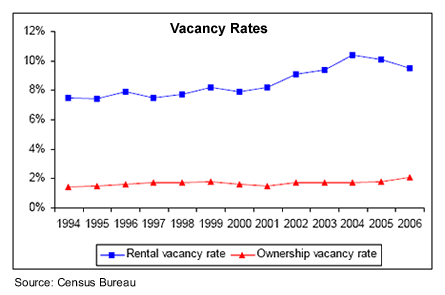
Second, rental vacancy rates hit record levels in 2004 causing rents to fall relative to home prices. This has made renting more attractive to potential homebuyers.

vacancy_rates

Third, interest rates are likely to increase due to reduction in bond purchases from China and Japan. As a by-product, the decrease in demand for mortgage-backed securities will cause lenders to tighten their lending standards.

The Bubble Has Already Popped

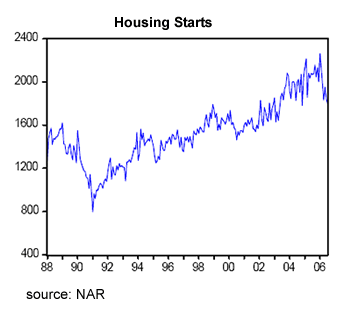
Recent data suggests that the party is over in the housing sector. Over the last 12 months, housing starts were down 13.3%, existing-home sales were down 11.2% , median home prices were up only 0.9% (down in real terms), 30-year mortgage rates were at 6.52% up from 5.70%, and housing inventory levels are up 3.2% in July from June’s levels which represents a 7.3 month supply at the current sales pace.

housing_starts

How Much Will Prices Fall?

Until the mid-nineties home prices hardly ever increased in real-terms. Robert Shiller estimates that house prices in America rose by an annual average of only 0.4% in real terms between 1890 and 2004. But since 1995 it has increased by 50%. Therefore, over time mean reversion suggests that real prices should fall by around 50%.

real_house_sale_prices

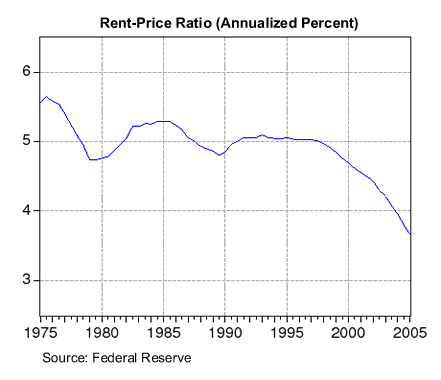
Looking at the price-to-rent ratio for homes — which is a similar valuation metric as the price-to-earning ratio used for equities — indicates that the ratio is about 50% higher than its long-term average. Most likely in the future we will see both an increase in rents and a decrease in prices.

rent_price_ratio

My own expectation is for home prices to fall by around 50% in real-terms over the next 5-10 years. Prices should fall more on the coasts where homes benefited more from the bubble. Since markets tend to oscillate between being overvalued and undervalued, I expect the upcoming real estate bear market to produce some terrific deals. I personally plan to keep my powder dry until then in order to buy a nice beachfront property that will probably still be selling at today’s prices.

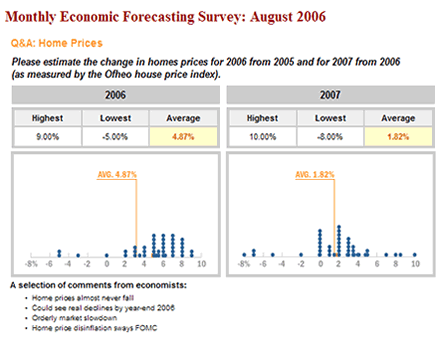
To get a sense of how uncommon my expectations are for the housing market, I need to look no further than Wall Street economists. The WSJ’s economics forecasting survey for August showed that economists on average are expecting housing prices to increase by 4.87% in 2006 and 1.82% in 2007.

august_homeprice_forecast_wsjSource: WSJ.com

I think the economists are overly optimistic — my own forecast is for nominal house prices to increase by no more than 2% this year and drop in 2007. That is, real prices will fall this year and continue falling for the rest of this decade.